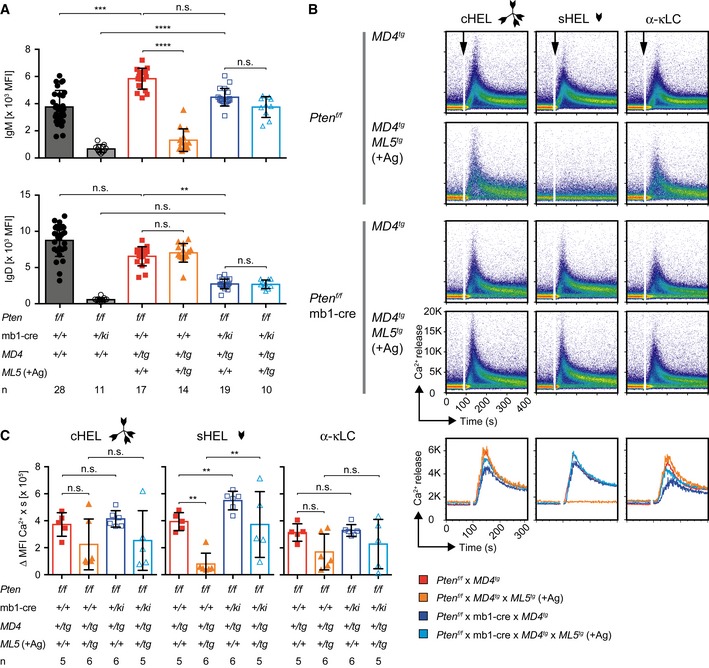
Figure 6. IgD expression modulates B‐cell responsiveness.

- Quantification of surface IgM (top) and IgD (bottom) MFI in B cells from mice of the indicated genotypes. Single dots represent the average MFI of four independent measurements per mouse (n), mean ± SD. IgD expression of Pten f/f × MD4 tg and Pten f/f × mb1‐cre × MD4 tg B cells already shown in Fig 3C. Statistical significance was calculated by using the Kruskal–Wallis test (see also Appendix Table S5), n.s. = not significant; **P ≤ 0.01; ***P ≤ 0.001; ****P ≤ 0.0001.
- Representative intracellular Ca2+ influx measured in Thy1.2− splenocytes, derived from mice of the indicated genotypes, upon stimulation with cHEL, monovalent sHEL (both at a concentration of 1 μg/ml) or 10 μg/ml α‐mouse κLC antibody, respectively. Line diagrams below the dot plots show the overlaid MFI of the Ca2+ influx kinetics displayed in the plots above.
- Quantification of intracellular Ca2+ influx from Fig 6B. The median area under the curve of the Ca2+ influx kinetics was calculated, and single dots represent data from individual mice, mean ± SD. Statistical significance was calculated by applying the Mann–Whitney U‐test (see also Appendix Table S6), n.s. = not significant, **P ≤ 0.01.
