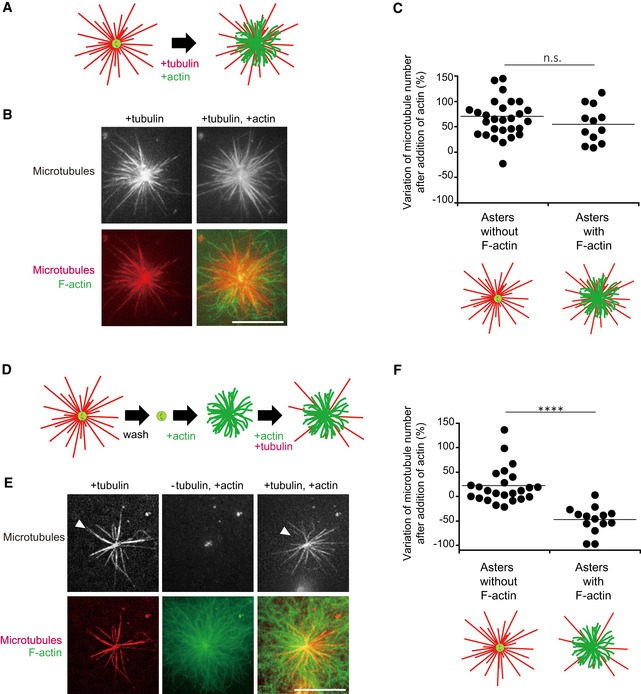
Schematic illustration of the first dynamic assay: sequential addition of tubulin followed by tubulin and actin on isolated centrosomes.
Representative images showing microtubules (top line) and the merged images of F‐actin and microtubules (bottom line) for the two steps of the assay; in the presence of tubulin only (left column) and in the presence of tubulin and actin (right column). Scale bar: 10 μm.
Quantification of the differences in the number of microtubules per centrosome between the two stages of the experiment described above on centrosomes capable (first condition), or not (second condition), to grow F‐actin. Data were collected from a single experiment; asters without F‐actin: n = 29; asters with F‐actin: n = 13. Data were analysed using Mann–Whitney test.
Schematic illustration of the second dynamic assay: tubulin is added to measure centrosome nucleation capacity and washed out. Then, actin is added followed by actin and tubulin.
Representative images showing microtubules (top line) and the merged images of F‐actin and microtubule (bottom line) during the three steps of the assay; in the presence of tubulin only (left column), in the absence of tubulin and presence of actin (middle column) and in the presence of tubulin and actin (right column). Scale bar: 10 μm. Arrowheads indicate microtubules unable to re‐grow after assembly of F‐actin.
Quantification of the differences in the number of microtubules per centrosome between the first and last steps of the experiment described above (panels D and E) on centrosomes capable (first condition), or not (second condition), to grow F‐actin. Data were pooled from two independent experiments; asters without F‐actin: n = 24; asters with F‐actin: n = 13. ****P < 0.001 Student's t‐test.

