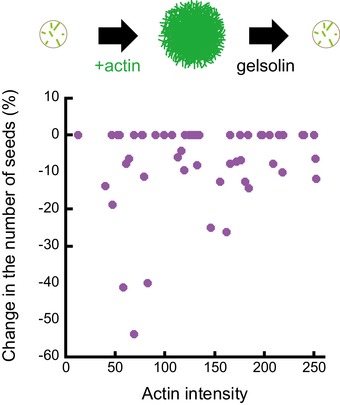
Figure EV4. Impact of actin filament growth on the number of microtubule seeds on micropatterns.

These data are associated with the set of experiments shown in Fig 5C–E and aimed at testing the impact of actin filament growth on the presence of microtubule seeds on the micropatterned region. Top line shows a schematic illustration of the dynamic assay: the number of microtubule seeds was counted on each micropattern, then actin was added to trigger actin filament assembly on the micropattern, then actin filaments were disassembled with gelsolin and the amount of microtubule seeds was counted again. The graph shows the variation of the amount of seeds before and after the growth of actin filaments depending on the density of the actin network. Dense networks did not seem to remove more seeds than sparse actin networks.
