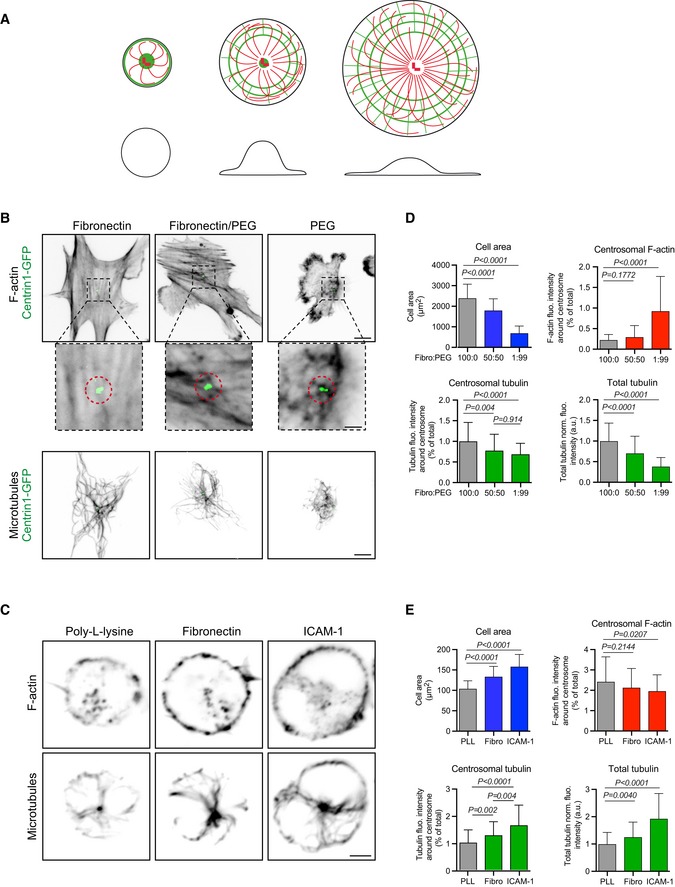
Schematic illustration of our model according to which cell spreading sequesters monomeric actin to the cortex and thereby enables the centrosome to grow more microtubules. Drawings show top (top line) and side views (bottom line) of cells with increased spreading from left to right. Actin filaments are in green; microtubules are in red.
RPE1 cells stably expressing centrin1‐GFP were plated for 3 h on coverslips coated with different ratios (100:0; 50:50 or 1:99) of fibronectin and PLL‐PEG prior to fixation and staining for F‐actin (top line and magnified views around centrosome below. Scale bars: 10 μm and 2 μm, respectively) and α‐tubulin (bottom line. Scale bar: 10 μm).
IIA1.6 B lymphoma cells were plated for 60 min on poly‐L‐lysine, fibronectin or ICAM‐1‐coated cover slides prior to be fixed and stained for F‐actin (top line) and α‐tubulin (bottom line). Scale bar: 3 μm.
Quantification of the area occupied by RPE1 cells on the substrate (top left), F‐actin content at the centrosome (top right), polymerized tubulin at the centrosome (bottom left) and in the entire cell (bottom right) for the three conditions of cell adhesion described in (B). Measurements came from three independent experiments with more than 60 analysed cells in each. Error bars represent standard deviations. F‐actin and microtubule contents were compared using Mann–Whitney test, and variations of the cell area were compared using unpaired t‐test.
Quantification of the area occupied by B lymphoma cells on the substrate (top left), F‐actin content at the centrosome (top right), polymerized tubulin at the centrosome (bottom left) and in the entire cell (bottom right) for the three conditions of cell adhesion described in (D). Measurements came from three independent experiments with more than 80 analysed cells in each. Error bars represent standard deviations. F‐actin and microtubule contents were compared using Mann–Whitney test, and variations of the cell area were compared using unpaired t‐test.

