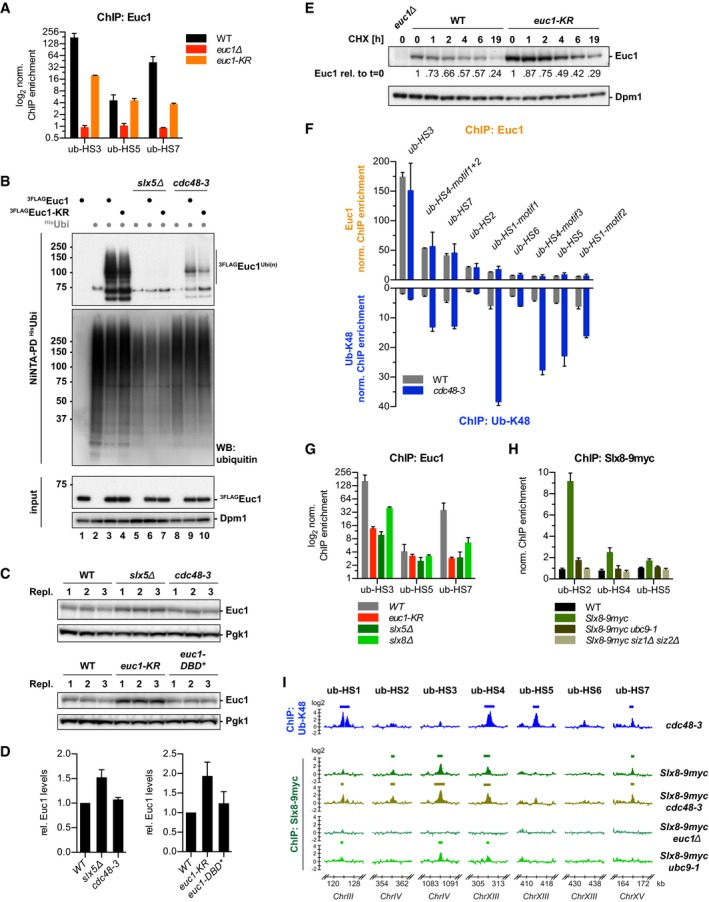
Figure EV2. Related to Fig 4. Slx5/Slx8‐mediated ubiquitylation does not lead to fast Euc1 degradation.

-
AEuc1 binding to ub‐HSs drops in euc1‐KR cells. ChIP against Euc1 was quantified by qPCR. Data represent means ± SD (n = 2).
-
BSlx5 is required for Euc1 ubiquitylation. Denaturing NiNTA‐PDs with HisUbi as in Fig 4E. Note that Euc1 ubiquitylation levels were abolished in slx5∆ cells, but also reduced in cdc48‐3 cells.
-
C, DEuc1 levels increase in slx5∆ and for euc1‐KR. Euc1 levels were quantified from WBs of three replicate samples (C) using a LI‐COR Odyssey Fc imaging system and normalized to Pgk1 and wild‐type levels (D). Pgk1 served as loading control. Data represent means ± SD (n = 3).
-
EEuc1 shows slow degradation kinetics. Cells were treated with 0.5 mg/ml cycloheximide (CHX), and samples were taken at the indicated times. Quantification was done as in (C–D). Relative Euc1 signals are normalized to Dpm1 levels and to t = 0.
-
FEuc1 and ub‐K48 ChIP signals do not correlate. ChIP against Euc1 (top) and ub‐K48 (bottom) analyzed by qPCR for all ub‐HSs. Separate primer pairs were used for distinct motif occurrences within ub‐HS1 and ub‐HS4. Note that Euc1 signals did not increase in a cdc48‐3 strain. Data for ub‐K48 ChIP for ub‐HS3/HS5/HS7 are reproduced from Fig 1E for comparison. Data represent means ± SD (n = 2).
-
GEuc1 binding to ub‐HS sites is reduced—rather than increased—in slx5∆ and slx8∆ cells. ChIP against Euc1 was quantified by qPCR in the indicated strains. Note that the binding defect for Euc1 is similar for the euc1‐KR and slx5∆ strains. Data represent means ± SD (n = 2).
-
HSUMOylation is required for recruitment of Slx8‐9myc to ub‐HSs. ChIP against Slx8‐9myc was quantified by qPCR. Data represent means ± SD (n = 3).
-
IGenome‐wide binding profiles of Slx8 in euc1∆ and ubc9‐1 mutant cells. ChIP‐chip was performed as described in Fig 1A. Binding profiles for ub‐K48 (cdc48‐3) and for Slx8‐9myc (WT, cdc48‐3) are reproduced for comparison from Figs EV1A and 1B, respectively. Data represent means from two independent replicates.
Source data are available online for this figure.
