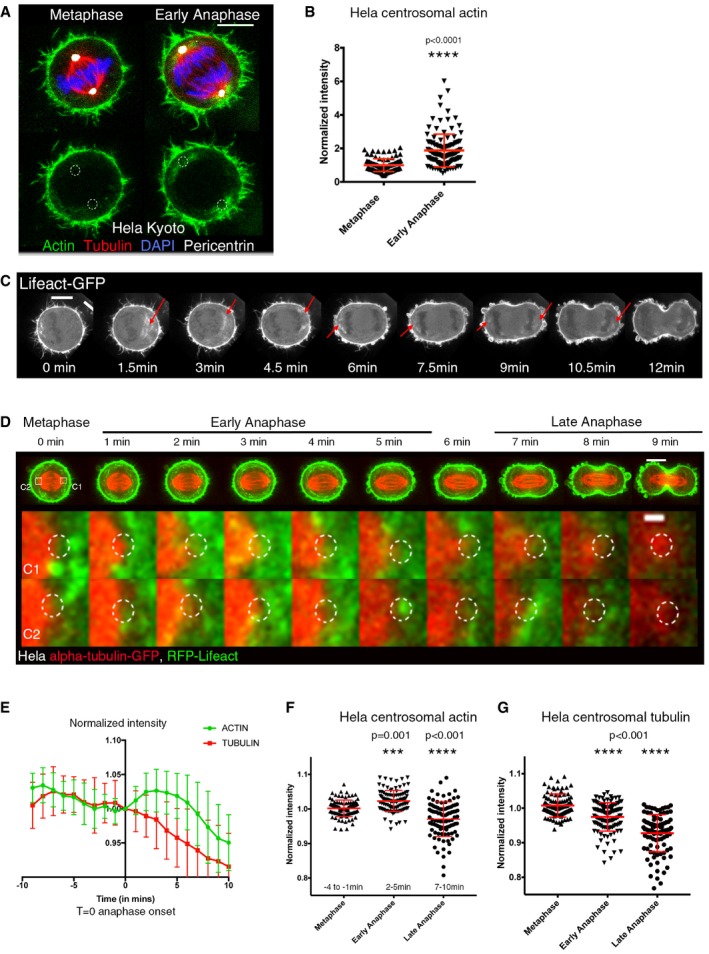
Maximum projection (2 z‐slices) of HeLa cells immunostained for F‐actin (phalloidin), tubulin, pericentrin and DAPI at metaphase and early anaphase showing actin accumulation around centrosomes in early anaphase. Scale bar = 10 μm
Quantification of F‐actin (phalloidin) intensity around pericentrin‐positive centrosomes in HeLa cells immunostained as in (A), showing the increase in F‐actin around centrosomes at early anaphase. Mean actin metaphase = 1 ± 0.03996, n = 92; mean actin anaphase = 1.875 ± 0.08895, n = 121; Student's t‐test, ****P < 0.0001.
Time‐lapse sequence from a representative HeLa cell expressing Lifeact‐GFP transiting from metaphase to anaphase, showing accumulation of actin in the presumptive centrosomal region, red arrows. Images represent 4z‐projection. Scale bar = 10 μm.
Time‐lapse sequence of a representative HeLa cell expressing GFP‐alpha‐tubulin and RFP‐Lifeact transiting from metaphase to anaphase showing the changes in actin and microtubules. Images represent 4 z‐projection of movies taken every 1 min. Bottom—higher magnification view of the centrosomes C1 and C2 from time lapse above showing a transient increase in actin around the centrosomes in early anaphase. Scale bar = 10 μm, 1 μm in zoom. T = 0 is one frame before anaphase onset. Dotted circle shows centrosome position.
Integrated fluorescence intensity of GFP‐alpha‐tubulin and RFP‐Lifeact around the centrosomes for a population of cells exiting mitosis, showing actin accumulation around the centrosomes and a simultaneous decrease in tubulin over time. N = 30 centrosomes (15 cells). T = 0 is one frame before anaphase onset. Graph shows mean ± SD, and values were normalised to intensity at T = 0.
Quantification and comparison of actin (RFP‐Lifeact) and tubulin (a‐tubulin‐GFP) fluorescence intensity around the centrosomes at metaphase (−4 to −1 min), early anaphase (2–5 min) and late anaphase (7–10 min) for a population of cells. Mean actin intensity at metaphase = 1.002 ± 0.0239, n = 97; early anaphase = 1.023 ± 0.03047, n = 101; late anaphase = 0.9703 ± 0.05004, n = 98. Tubulin intensity at metaphase = 1.008 ± 0.03356, n = 106; early anaphase = 0.9748 ± 0.04124, n = 116; late anaphase = 0.9276 ± 0.05382, n = 101; one‐way ANOVA.

