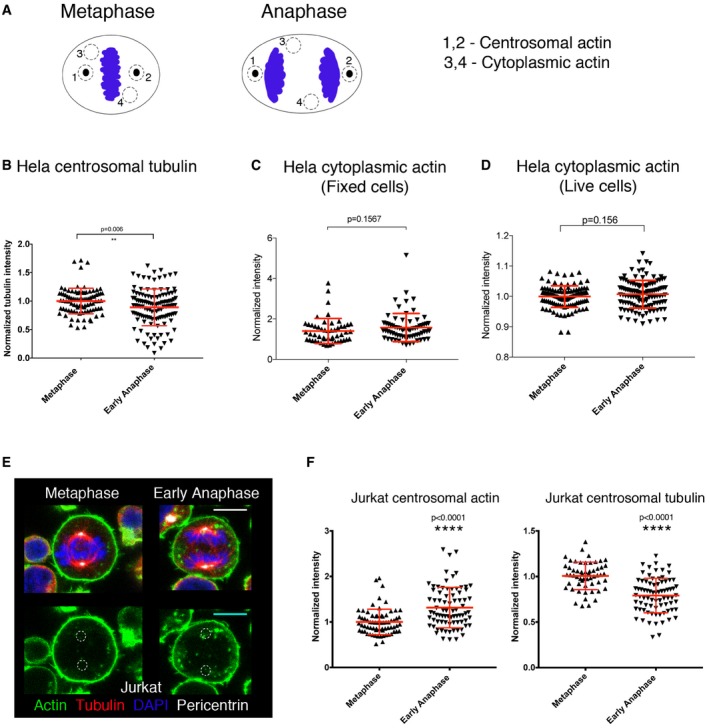
Figure EV1. Actin dynamics during mitotic exit in fixed cells.

- Schematic representation of metaphase and anaphase cell explaining the pools of actin measured in fixed cells. 1 and 2 refer to centrosomal actin, while regions 3 and 4 measure non‐centrosomal or cytoplasmic actin.
- Quantification of tubulin intensity around pericentrin‐positive centrosomes in HeLa cells immunostained as in (Fig 1A), showing the decrease in tubulin intensity around centrosomes at early anaphase. Mean tubulin metaphase = 1 ± 0.02363, n = 90; mean tubulin anaphase = 0.89 ± 0.02937, n = 120; Student's t‐test, P = 0.006.
- Quantification of non‐centrosomal actin during metaphase and anaphase in fixed HeLa cells (as in Fig 1A and B, Scheme in EV1A) shows that there is no significant increase in the amount of cytoplasmic actin during this period. Mean actin intensity at metaphase = 1.403 ± 0.086, n = 52; mean actin intensity at anaphase = 1.574 ± 0.08301, n = 70, P = 0.1567. All values were normalised to mean actin intensity around centrosomes at metaphase. Error bars indicate standard deviation.
- Quantification of non‐centrosomal actin during metaphase and early anaphase in live HeLa cells (as in Fig 1D and E, Scheme EV1A) shows that there is no significant increase in the amount of non‐centrosomal actin during this period. Mean actin intensity at metaphase = 0.9994 ± 0.003416, n = 108 and mean actin intensity at anaphase = 1.007 ± 0.004158, n = 120. P = 0.1561, Welch's t‐test. All values were normalised to mean actin intensity around centrosomes at metaphase. Error bars indicate standard deviation.
- Maximum projection (2 z‐slices) of Jurkat cells immunostained for F‐actin (phalloidin), tubulin, pericentrin and DAPI at metaphase and early anaphase showing the actin accumulation around centrosomes in early anaphase. Scale bar = 10μm
- Quantification of F‐actin (phalloidin) and tubulin intensity around pericentrin‐positive centrosomes in Jurkat cells immunostained as in (D), showing the increase in F‐actin around centrosomes at early anaphase with a decrease in tubulin. Mean actin metaphase = 1 ± 0.03351, n = 70; mean actin anaphase = 1.315 ± 0.04993, n = 79; mean tubulin metaphase = 1.006 ± 0.02017, n = 56; mean tubulin anaphase = 0.7905 ± 0.02144, n = 78, Student's t‐test for both, ****P < 0.0001.
