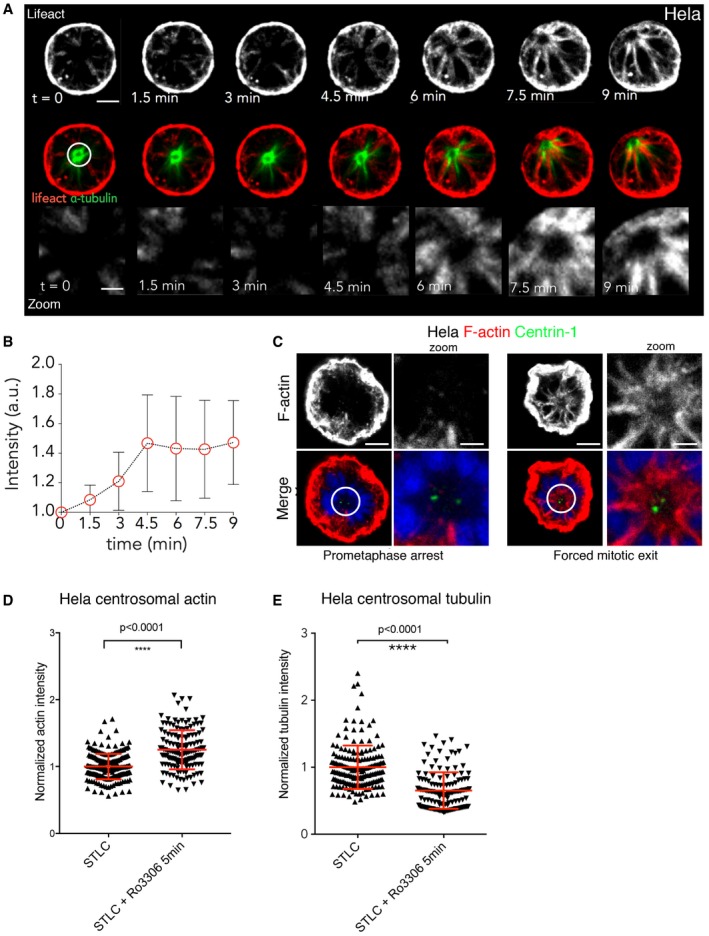
Stills from time lapse of HeLa cells expressing GFP‐alpha‐tubulin and RFP‐Lifeact arrested at prometaphase with STLC (t = 0) and forced to exit mitosis with Cdk1 inhibition (RO‐3306) imaged every 90 s. Scale bar = 10 μm and for zoom = 4 μm. n = 21 cells from four independent experiments.
Quantification of actin around centrosomes when cells are forced to exit mitosis using Cdk1 inhibition as in (A), showing a similar accumulation of actin as observed in bipolar divisions. Graph shows mean actin accumulation normalised to t = 0, and errors bars indicate standard deviation.
HeLa cells expressing GFP‐centrin 1 arrested at prometaphase or forced mitotic exit (RO‐3306 5′) and stained with phalloidin. Scale bar = 5 μm and for zoom = 2 μm.
The level of actin around the centrosome in (C) was quantified and normalised relative to metaphase and shows an increase during forced mitotic exit. STLC arrest 1 ± 0.01317, n = 210; STLC+RO‐5 min = 1.251 ± 0.02441, n = 144; unpaired t‐test with Welch correction, ****P < 0.0001.
Quantification of tubulin intensity around centrosomes during prometaphase‐arrested cells or cells forced to exit with Cdk1 inhibitor. Tubulin intensity decreases during forced mitotic exit. STLC‐DMSO = 1 ± 0.02407, n = 180; STLC‐RO‐3306 = 0.6516 ± 0.02337, n = 136. P < 0.0001, Welch's t‐test.

