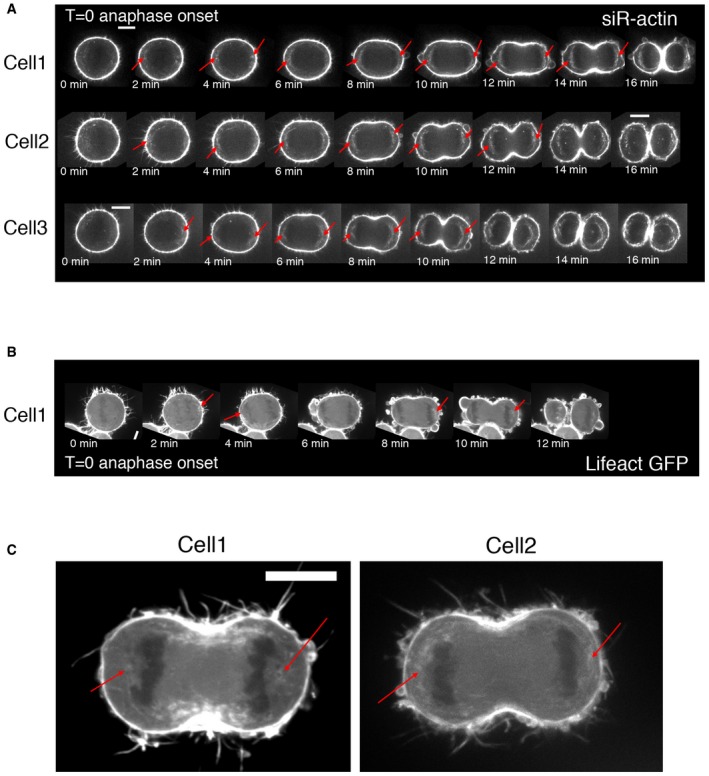
Figure EV2. Actin dynamics during mitotic exit in live cells.

- Representative images of time lapse of HeLa cells imaged with siR‐actin, every 1 min. Red arrows point to actin in the presumptive centrosomal region. Note that with siR‐actin, this pool of actin around centrosomes persists for a longer time.
- Representative images of time lapse of HeLa cells expressing Lifeact‐GFP, imaged every 1 min. Red arrows point to presumptive centrosomal region. This reporter shows a more widespread accumulation of cytoplasmic actin, with frequent enrichment around one or both centrosomes.
- Stills from time lapse of HeLa cells expressing Lifeact‐GFP, showing actin enrichment around both centrosomes.
