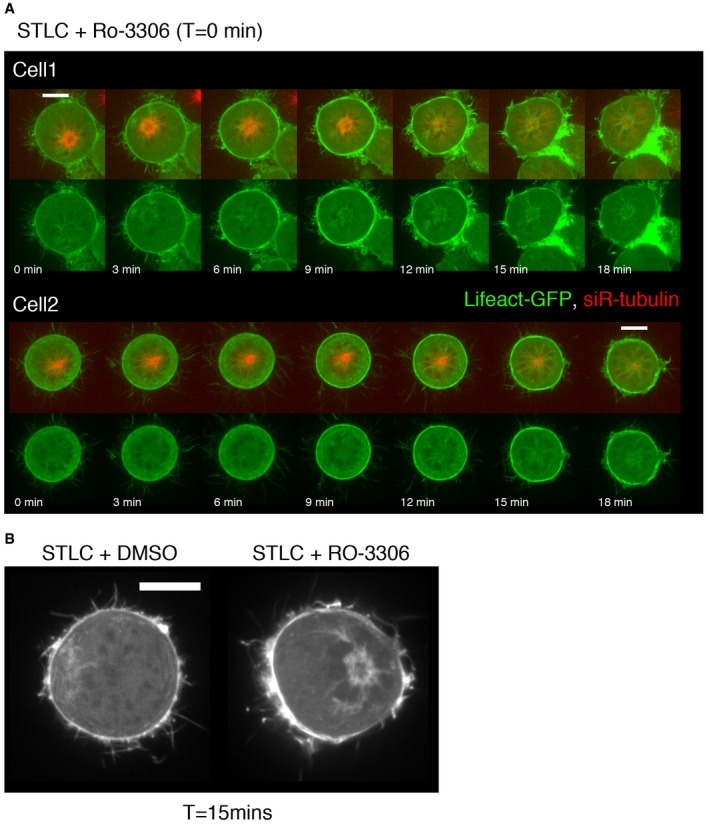
Figure EV3. Actin dynamics during forced exit in HeLa cells.

- Stills from time lapse of HeLa cells expressing Lifeact‐GFP and labelled with siR‐tubulin during monopolar exit, imaged every 1.5 min, showing actin accumulation around centrosomes.
- High‐resolution image of Lifeact‐GFP localisation in cells arrested in prometaphase (+DMSO) or cell forced to exit with Cdk1 inhibitor, for 15 min, showing actin accumulation around the centrosomes.
