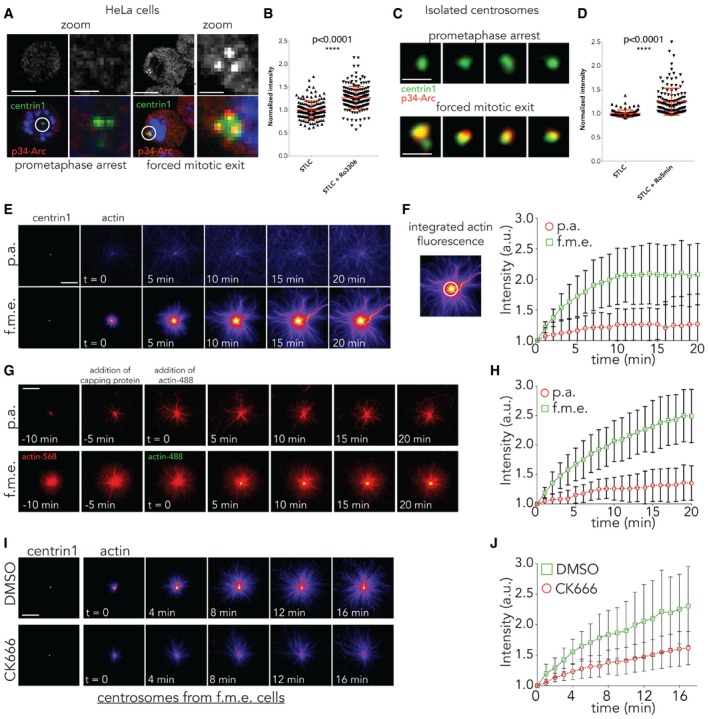
Z‐projection of HeLa cells expressing GFP‐centrin 1 immunostained for p34‐Arc (sub‐domain Arp2/3) following prometaphase arrest and forced mitotic exit for 5 min. N = 3 independent experiments. Scale bar = 10 μm and for zoom = 2 μm.
Levels of p34‐Arc around the centrosome (3um area) were quantified relative to metaphase and increase during forced mitotic exit. STLC arrested = 1 ± 0.01576, n = 153; STLC+RO‐3306 = 1.268 ± 0.01748, n = 191; ****P < 0.0001, unpaired t‐test with Welch correction. Error bars represent standard deviation.
Z‐projection of centrosomes isolated from cells expressing GFP‐centrin 1 during prometaphase arrest and forced exit, which were immunostained with p34‐Arc. N = 2 independent experiments. Scale bar = 2 μm.
Quantification of p34‐Arc levels around the centrosome in (C), relative to metaphase, showing its increase during forced exit. STLC arrested = 1 ± 0.00779, n = 93; STLC+RO‐3306 = 1.249 ± 0.02446, n = 134; ****P < 0.0001, unpaired t‐test with Welch correction. Error bars represent standard deviation.
Time lapse of in vitro assay on centrosomes isolated from prometaphase‐arrested cell and cells forced to exit mitosis showing centrosomal actin nucleation over time. Scale bar = 10 μm
Quantification of actin nucleation from isolated centrosomes as in (E) over an area of 2 μm (white circle), showing an increase in actin nucleation around centrosomes isolated from cells undergoing forced mitotic exit. N = 2 isolations, five independent experiments, n = 16 STLC and n = 19 STLC‐RO.
Colour switch experiment using green‐ and red‐labelled actin. Red actin was used first, followed by capping protein, and then green‐labelled actin. The accumulation of green in the centre indicates that actin is nucleated at the centrosome. Scale bar = 10 μm.
Quantification of (G) over the time. N = 2 isolations, two independent experiments, n = 19 STLC and n = 14 STLC‐RO. Error bars represent standard deviation.
Time lapse showing cytoplasmic actin filament formation at centrosomes isolated from cells undergoing forced exit when pre‐treated with DMSO or CK666. Scale bar = 10 μm.
Quantification of (I), showing that centrosomal actin nucleation fails when centrosomes isolated from cells undergoing exit are pre‐treated with CK666. N = 2 isolations, two independent experiments, n = 17 RO+DMSO, 26 RO+CK666 24 STLC+DMSO, 23 STLC+CK666. Error bars represent standard deviation.

