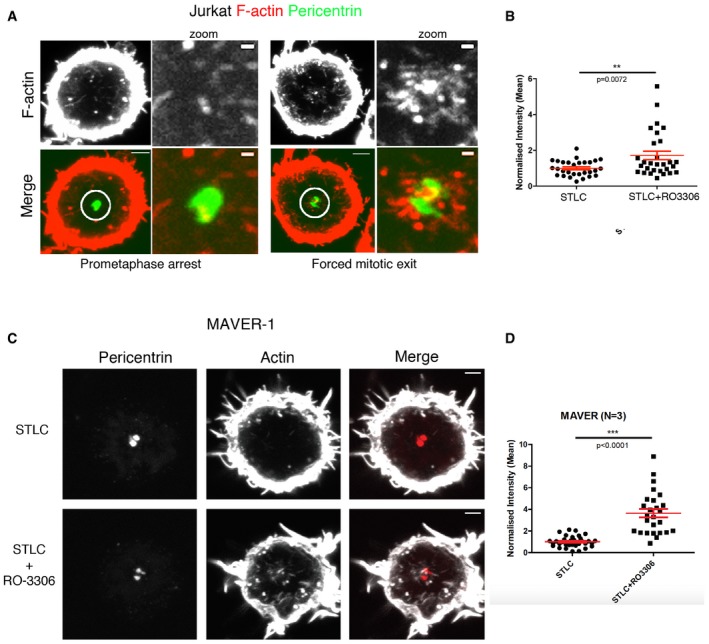
Figure EV4. Actin dynamics during forced exit in Jurkat and MAVER1 cell lines.

- Maximum projection view of Jurkat cells immunostained for F‐actin (phalloidin) and pericentrin arrested at prometaphase with STLC and forced to exit mitosis with RO‐3306 (10 min) showing the increase in F‐actin around centrosomes during forced exit. Scale bar = 5 μm and for zoom = 1 μm.
- The level of actin around the centrosome in (A) was quantified and normalised relative to metaphase and shows an increase during forced mitotic exit. STLC arrest = 1.000 ± 0.08018, N = 29; STLC+RO‐5 min = 1.713 ± 0.2361, N = 29, Welch's t‐test, P = 0.0072.
- Maximum projection image of MAVER1 cells arrested in prometaphase with STLC and forced to exit with STLC+RO‐3306 addition (10 min), immunostained with pericentrin (for centrosomes) and phalloidin (F‐actin), showing the increase in actin around the centrosomes during the forced exit. Scale bar = 5 μm
- Quantification for MAVER1 cells stained as above, showing the increase in actin during forced mitotic exit. STLC arrested = 1.000 ± 0.08336, N = 35; STLC+RO‐5 min = 3.647 ± 0.3894, N = 26; Welch's t‐test, ****P < 0.0001. Error bars indicate standard error of the mean.
