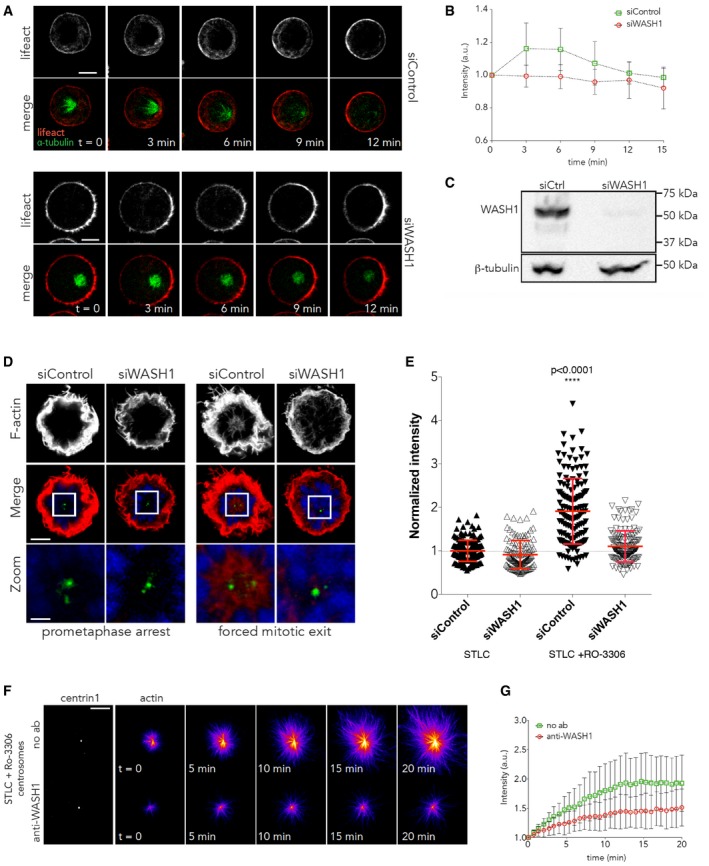
Time lapse of HeLa cells expressing GFP‐alpha‐tubulin and RFP‐Lifeact treated with control siRNA or siRNA against WASH1 for 48 h arrested at prometaphase and forced to exit mitosis with RO‐3306 addition (t = 0). Scale bar = 5 μm.
Quantification of actin around the centrosome in (A), showing the failure to accumulate actin around the centrosome in siWASH. N = 4 experiments. Error bars represent standard deviation.
Western blots of lysates from cells treated with siRNA control and siRNA against WASH1 probed with WASH1 antibody, showing the reduction in WASH levels following treatment of cells with siRNA against WASH. Scale bar = 5 μm and 2 μm in zoom.
Z‐projection of HeLa cells expressing GFP‐centrin 1 treated with control siRNA or siRNA against WASH, arrested at prometaphase or forced to exit mitosis and immunostained with phalloidin. Scale bar = 5μm
Quantification of actin around the centrosome in (F), showing the failure to accumulated actin around the centrosome during forced exit in cells treated with siRNA against WASH. siControl‐STLC = 1 ± 0.0189, n = 165; siWASH‐STLC = 0.9138 ± 0.0298, n = 118; siControl‐STLC+RO‐3306 = 1.911 ± 0.06221, n = 147; siWASH‐STLC+RO‐3306 = 1.103 ± 0.0301, n = 140. Error bars represent standard deviation. P < 0.0001, one‐way ANOVA.
Time lapse from in vitro assay with centrosomes isolated from cells undergoing forced exit was pre‐treated with either no antibody or anti‐WASH1 antibody for 1 h. Scale bar = 10 μm.
Quantification of in vitro assay from (F), showing the reduction in actin nucleation around centrosomes when they are pre‐treated with anti‐WASH1. Error bars represent standard deviation. Two independent experiments.