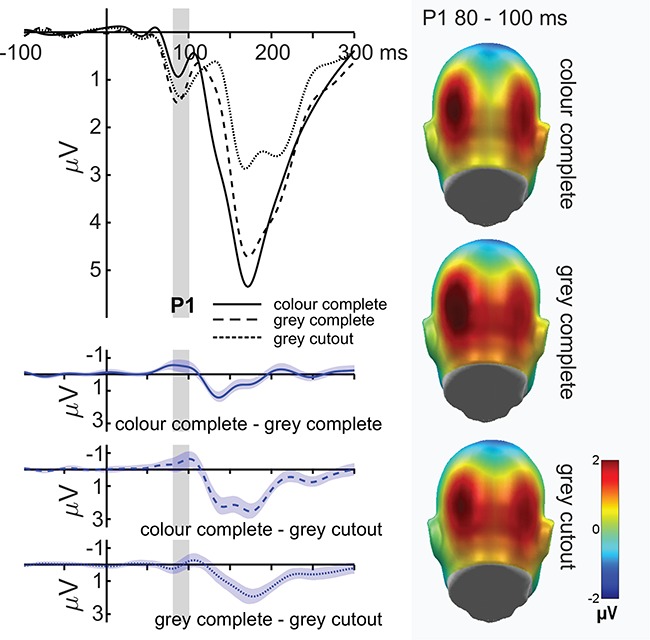
Fig. 2.

P1 modulations by depicted face naturalness. The left panel shows the time course for all face naturalness conditions, averaged over electrodes O1, Oz and O2. The right panel shows the amplitudes for each face naturalness condition. P1 amplitudes did not significantly differ between the naturalness levels. All difference plots (blue) contain 95% bootstrap confidence intervals of intraindividual differences.
