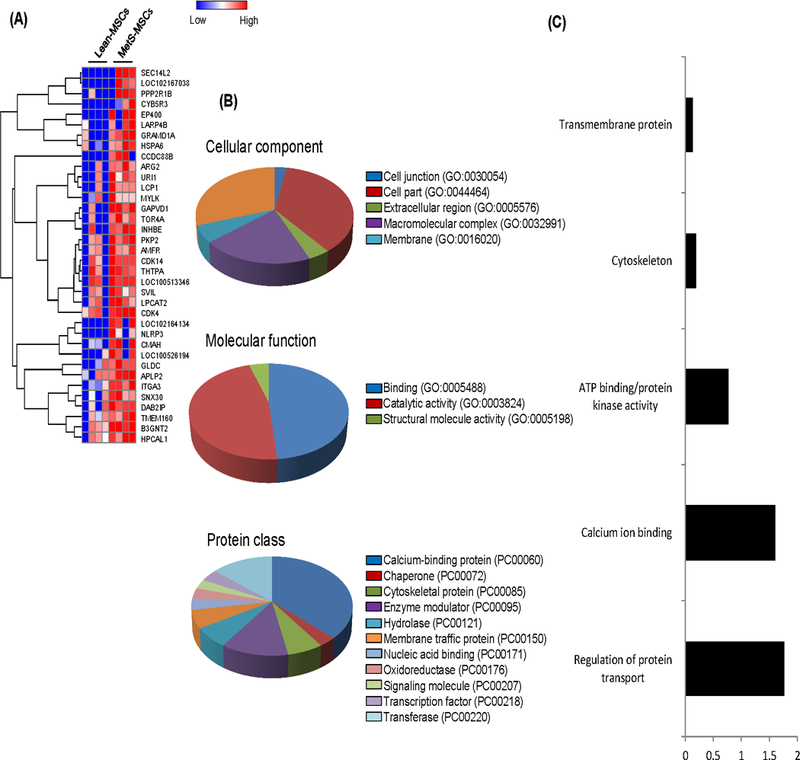
Figure 2.

Evaluation of 36 proteins upregulated in MetS-MSCs compared to Lean MSCs using A. Heat map; B. Protein Analysis through Evolutionary Relationships (PANTHER) analysis of cellular components, molecular function, and protein class; C. Functional annotation clustering (DAVID 6.7).
