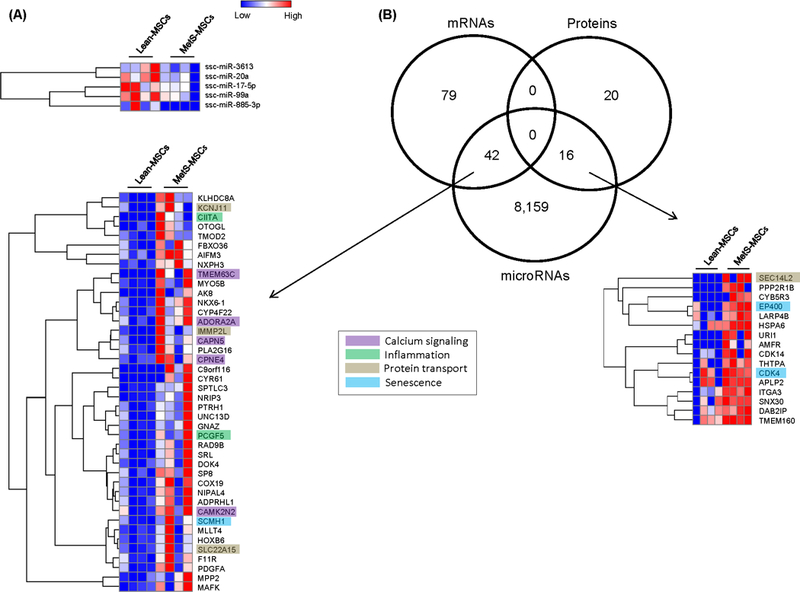
Figure 5.

A. Five downregulated miRNA in MetS-MSCs compared to Lean-MSCs per Heat map. B. Interactions among miRNA, mRNA and proteins in Lean and MetS MSCs. Venn diagram showing distribution of downregulated miRNA, upregulated mRNA, and proteins in MSCs and their interactions and Heat maps.
