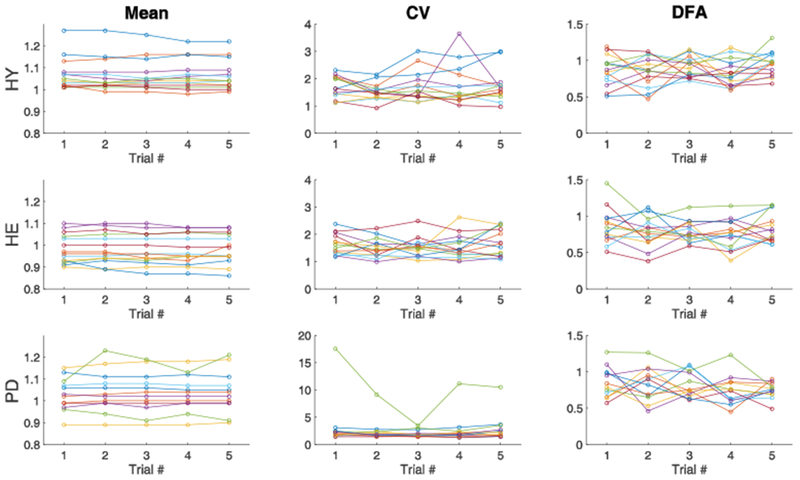
Figure 2.

Comparison of the mean (left), coefficient of variation (middle) and α-DFA (right) from stride time series in the five 3-min trials in healthy young (top), healthy elderly (middle) and Parkinson’s disease (bottom) groups. Each color within a group represents a single participant.
