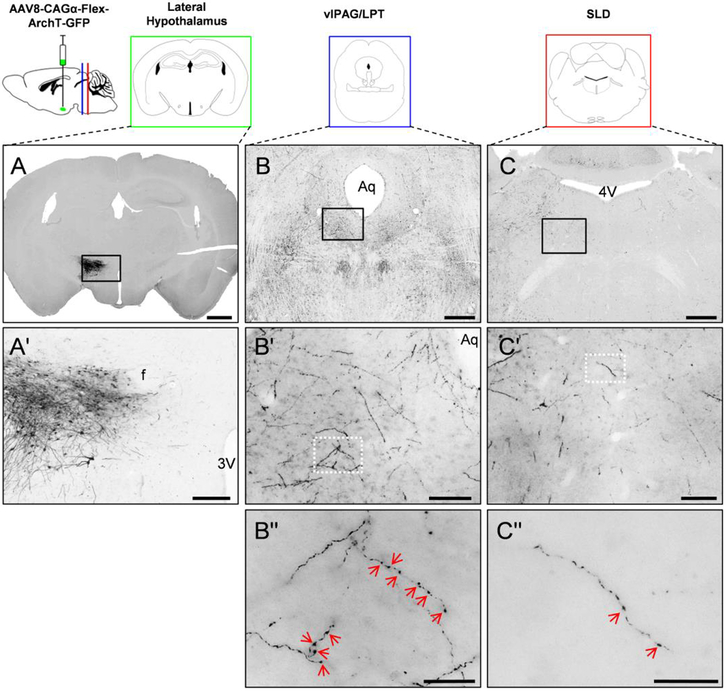
Figure 1. Anterograde tracing from lateral hypothalamic MCH neurons to the primary sites of REMs control.
MCH neurons (A– injection site in LH) innervate the REMs-suppressing vlPAG/LPT (B) as well as the REMs-generating SLD (C) in the brain stem, as indicated by the presence of ArchT-GFP labeled axon terminals (black color) in these regions. Black squares in A, B and C represent the regions magnified in A′, B′ and C′ and white squares in B′ and C′ represent the regions magnified in the Bʹʹ and Cʹʹ. Red arrowheads in Bʹʹ and Cʹʹ indicate individual boutons. Scale bars are: (A) 1mm; (B, C) 0.5 mm; (A′) 200 μm; (B′, C′) 100 μm; (Bʹʹ and Cʹʹ) 20 μm. 3V, 3rd ventricle; 4V 4th ventricle; Aq, aqueduct; f, fornix.

