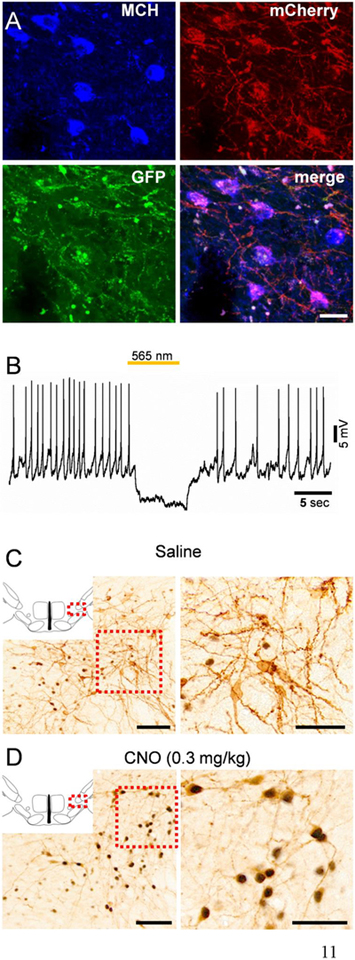
Figure 2. Chemoactivation and optogenetic inhibition of MCH neurons.
(A) Triple-labeled neurons in the LH indicating the expression of hM3Dq-mCherry (red; native florescence) and ArchT-GFP (green; native florescence) in MCH neurons (blue; immunofluorescence labeling with rabbit anti-MCH and goat anti-rabbit antibodies). (B) Representative whole cell, current clamp recording from an ArchT-expressing MCH neuron (identified by GFP fluorescence) indicating hyperpolarization and complete cessation of action potentials induced by 565 nm light illumination (yellow/orange line above the trace). (C,D) c-Fos activity (black staining) in hM3Dq- and ArchT-expressing MCH neurons (mCherry labeling in brown) 2 h after saline (C) or CNO (0.3 mg/kg) application (D) indicating activation of MCH neurons by CNO. Scale bars are: (A) 20 μm; (C,D) overview images 100 μm; magnified images 50 μm.

