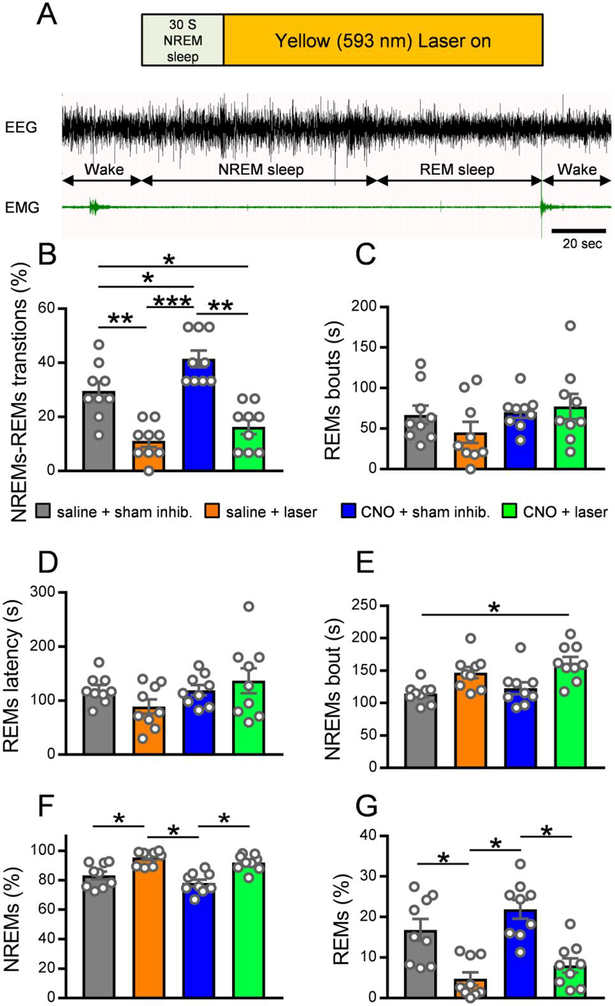
Figure 5: Optogenetic inhibition of MCH terminals in the vlPAG/LPT decreases NREMs-REMs transitions.
(A) Schematic illustration of the photo-inhibition paradigm during NREMs and REMs in MCH-Cre mice. Yellow/orange light (593.5 nm wave length) illuminations were applied after 30 seconds of stable NREMs and continued until the next wake bout irrespective of whether NREMs transitioned into REMs or wake. (B) Percentage of NREMs bouts transitioning to REMs. Repeated measures (RM) two-way ANOVA for ‘Drug treatment’ (F(1,8)=32.95, p=0.0004) and ‘Laser treatment’ (F(1,8)=49.73, p=0.0001), followed by Holm-Sidak’s multiple comparison test (saline + sham inhibition vs. saline + laser light, p=0.0068; saline + sham inhibition. vs. CNO + sham inhibition, p=0.0363; saline + sham inhibition vs. CNO + laser light, p=0.0309; saline + laser light vs. CNO + sham inhibition, p=0.0004; CNO + sham inhibition vs. CNO + laser light, p=0.0012). RM two-way ANOVAs for the duration of REMs bouts (C) and the latency to REMs onset (D) were not statistically significant (REMs bout duration ‘Drug treatment’ F(1,8)=2.853, p=0.1297, ‘Laser treatment’ F(1,8)=0.452, p=0.5203; REMs latency ‘Drug treatment’ F(1,8)=1.797, p=0.2169, ‘Laser treatment’ F(1,8)=0.5166, p=0.4928). (E) NREMs bout duration. RM two-way ANOVA for ‘Drug treatment’ (F(1,8)=8.766, p=0.0181) and ‘Laser treatment’ F(1,8)=19.3, p=0.0023, followed by Holm-Sidak’s multiple comparison test (saline + sham inhibition. vs. CNO + laser light, p=0.0282). (F) Percentage of NREMs during the 15 trials (starting with NREMs) within the 3h recording period. RM two-way ANOVA for ‘Drug treatment’ (F(1,8)=6.879, p=0.0305) and ‘Laser treatment’ (F(1,8)=61.61, p=0.≤0.0001), followed by Holm-Sidak’s multiple comparisons test (saline + sham inhibition vs. saline + laser light, p=0.05; saline + laser light vs. CNO + sham inhibition, p=0.0127; CNO + sham inhibition vs. CNO + laser light, p=0.0346). (G) Percentage of REMs during the 15 trials (starting with NREMs) within the 3h recording period. RM two-way ANOVA for ‘Drug treatment’ (F(1,8)=6.879, p=0.0305) and ‘Laser treatment’ (F(1,8)=61.61, p≤0.0001), followed by Holm-Sidak’s multiple comparisons test (saline + sham inhibition vs. saline + laser light, p=0.05; saline + laser light vs. CNO + sham inhibition, p=0.0127; CNO + sham inhibition vs. CNO + laser light, p=0.0346). Saline or CNO (0.3 mg/kg; i.p.) was injected at ZT6 and sham/laser light illumination was applied between ZT7-ZT10 (n = 9 mice). Data are Mean ± SEM, * P < 0.05, ** P < 0.01, *** P < 0.001, **** P < 0.0001. Scale bar in (A) is 20 sec.

