
Fig. 10:
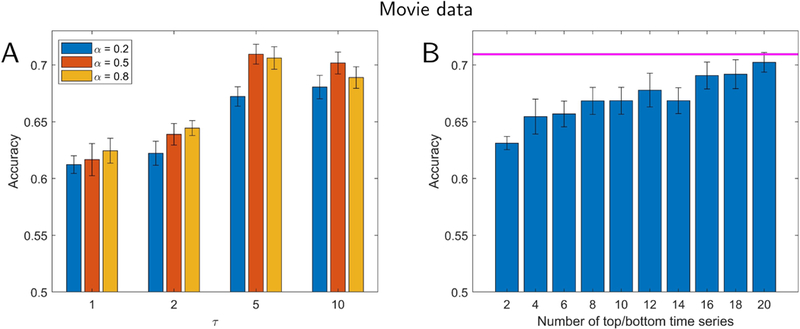
Classification for movie clips. Participants viewed short movie clips that were either scary or funny. (A) Accuracy as a function of the parameters α (which determines the forgetting rate) and τ (which determines reservoir size). (B) Lower-dimensional representation and classification accuracy. Accuracy is shown as a function of the number of “top” plus “bottom” components. The magenta line indicates the highest performance using all components. Classification accuracy with a lower-dimensional representation reached that of the full data with around 20 dimensions, and reached within 95% of the the full data with 12 dimensions. Error bars show the standard error of the mean across validation folds.