
Fig. 12:
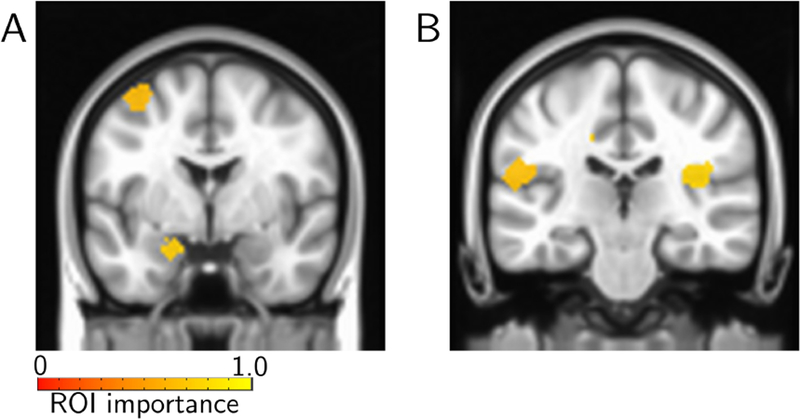
Importance maps for movie data. Lower-dimensional time series representation expressed on the brain. The colored ROIs are those with original fMRI time series expressing (“loading on”) “top” time series the most (see Fig. 2 for details). Regions supporting “scary” included the left amygdala (A) and the insula (B).