
Fig. 5:
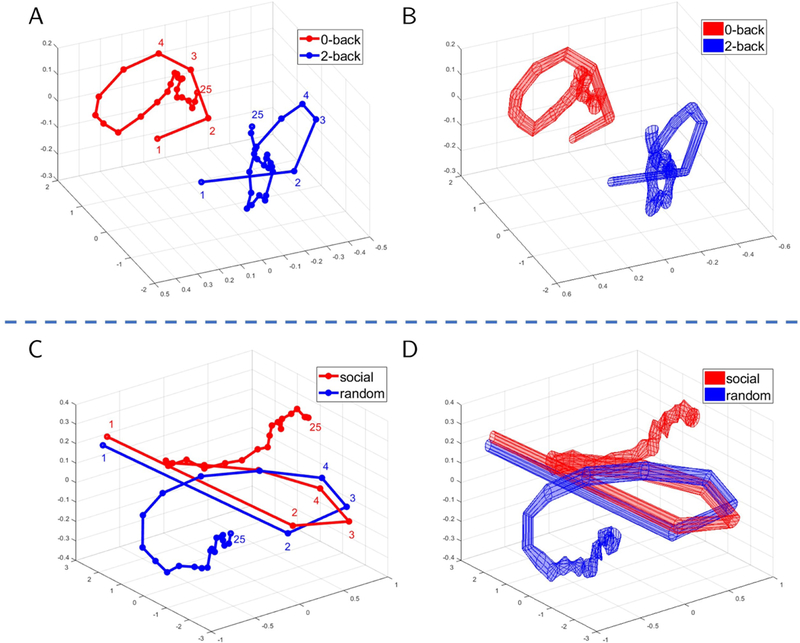
Temporal trajectories for task fMRI data. Mean trajectories are displayed in (A) for working memory and (C) for theory of mind. Variability (standard error across participants) is displayed in (B) and (D), respectively. For working memory data (A-B), the trajectories were well separated throughout the block. For theory of mind data (C-D), the trajectories initially overlapped but diverged after 6–7 points. Trajectories were based on the top three principal components.