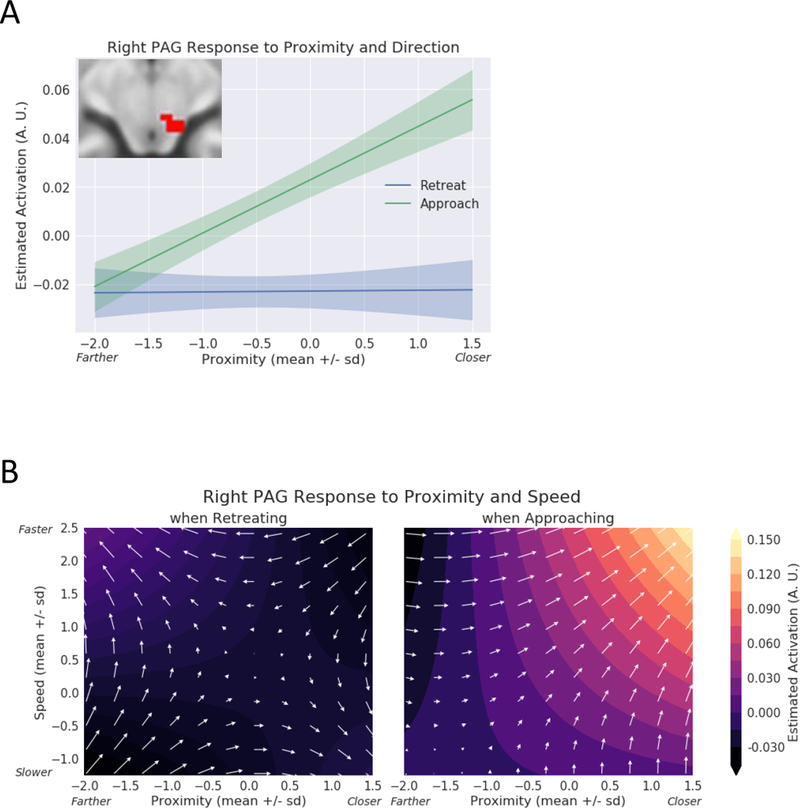
Figure 11.

Exploratory analysis of the periaqueductal gray (PAG). (A) Estimated responses for a range of proximity values. During approach, activity increased as a function of proximity; activity changed little during retreat periods. The confidence bands were obtained by considering within-subject differences (approach minus retreat); see Methods. A.U.: arbitrary units. (B) Contour plots show estimated responses for different combinations of proximity and speed during approach and retreat periods. Arrows point in the direction of signal increase. During approach, both proximity and speed simultaneously influenced responses, which increased when the circles were closer and speed was higher. A.U.: arbitrary units.
