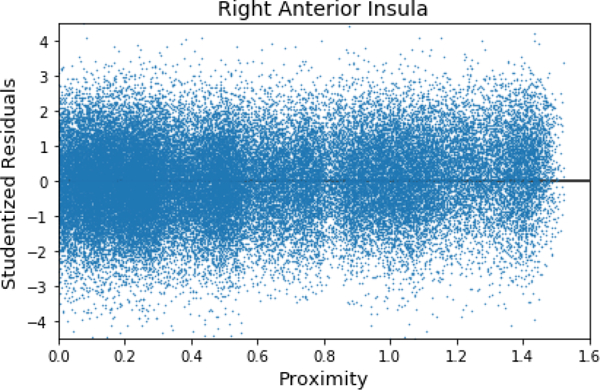
Figure 12.

Exploratory analysis of potential nonlinear effects of proximity. The residuals from the model fit are plotted as a function of proximity. No appreciable lack of fit is evident. To plot residuals for all participants, they were first studentized (jitter as a function of proximity was also used to reduce overlap).
