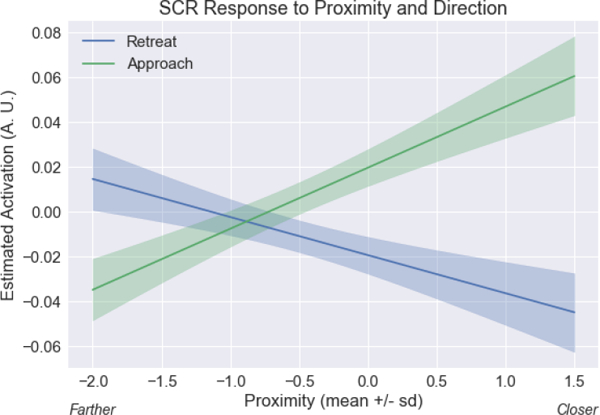
Figure 4.

Skin conductance response (SCR) proximity by direction interaction. Estimated responses for a range of proximity values. To display estimated responses, we varied proximity and estimated the response based on the linear model for SCR (analogous to the model of equation 1). The approach vs. retreat difference was greater when circles were near compared to far. The confidence bands were obtained by considering within-subject differences (approach minus retreat); see Methods. A.U.: arbitrary units.
