Figure 6.
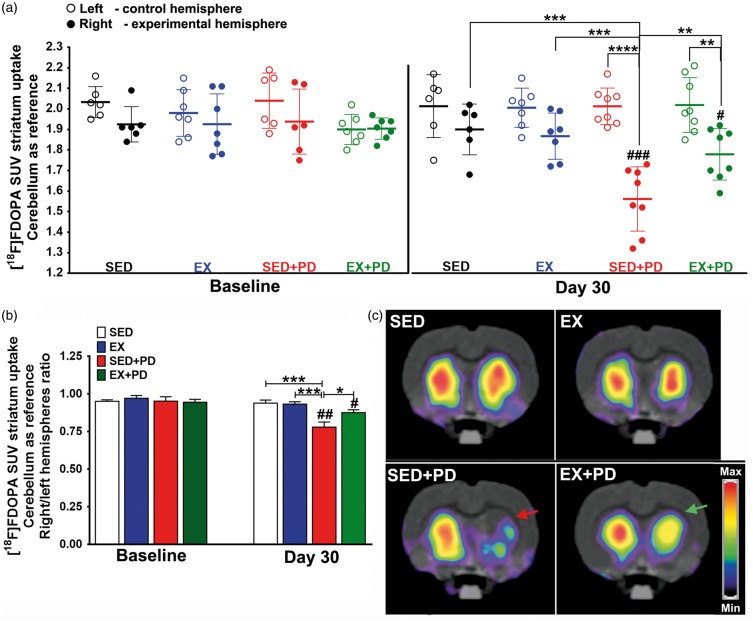
Results of [18F] FDOPA PET at baseline and 30 days after surgery. (a) Tracer uptake in the experimental (right) and control (left) striatum is normalized to the uptake in cerebellum and expressed as Standard Uptake Value (SUV) (b) Tracer uptake ratio between right and left striatum. (c) Examples of [18F]FDOPA PET images of transaxial brain sections containing the striatum, acquired at day 30 after surgery. [18F]FDOPA uptake is reduced in the striatum injected with 6-OHDA in sedentary animals (red arrow). Note that exercise partly reversed this effect in EX + PD animals (green arrow). Sedentary controls (SED); Exercised controls (EX); Sedentary PD rats (SED + PD); and exercised PD rats (EX + PD). Statistical differences between groups for the same brain hemisphere and between hemispheres for same group are presented as *p < 0.05; **p < 0.01; ***p < 0.001; ****p < 0.0001. Statistical differences in tracer uptake between baseline and day 30 are indicated as #p < 0.05; ## p < 0.01; ###p < 0.001.

