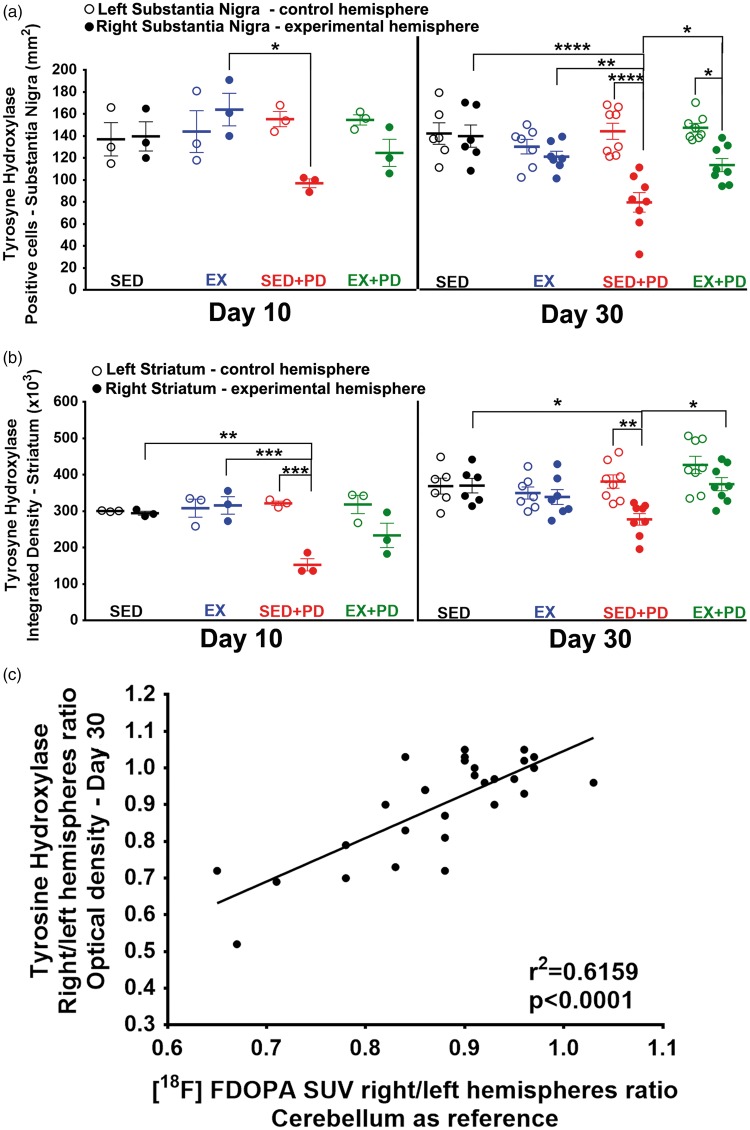
Figure 7.
(a) The number of TH-positive cells per mm2 for right and left substantia nigra 10 days and 30 days after surgery; (b) TH optical density for in the affected (right) and contralateral (left) striatum 10 days and 30 days after surgery; (c) Correlation between [18F]FDOPA uptake (SUV) ratio and TH staining ratio for striatum at 30 days after surgery. Sedentary controls (SED); Exercised controls (EX); Sedentary PD rats (SED + PD); and exercised PD rats (EX + PD). Statistical differences between groups for the same brain hemisphere and between hemispheres for same group are presented as *p < 0.05; **p < 0.01; ***p < 0.001; ****p < 0.0001.

