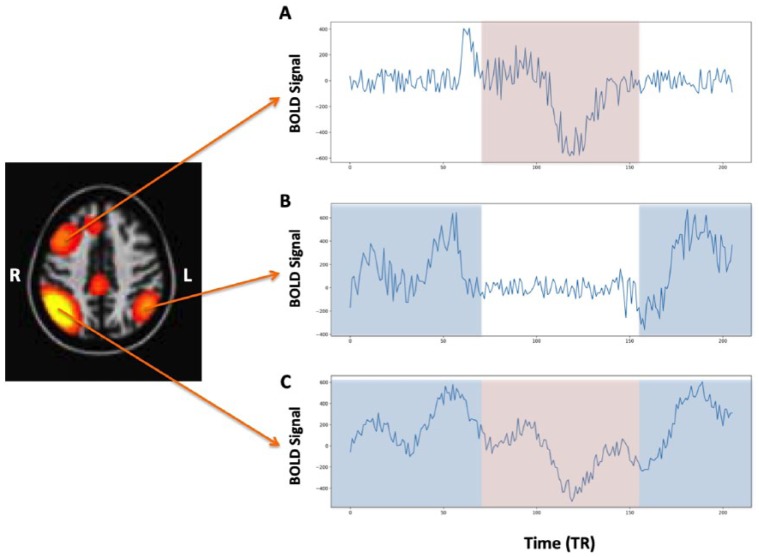
Figure 1.
Simulated example of a network where the (C) right parietal region communicates differentially between the (B) left parietal region and the (A) right prefrontal region. The light blue rectangles reflect the regions in the time series in which the correlations are highest between (A) and (B) and the light red rectangles reflect the regions of highest correlation between (A) and (C).

