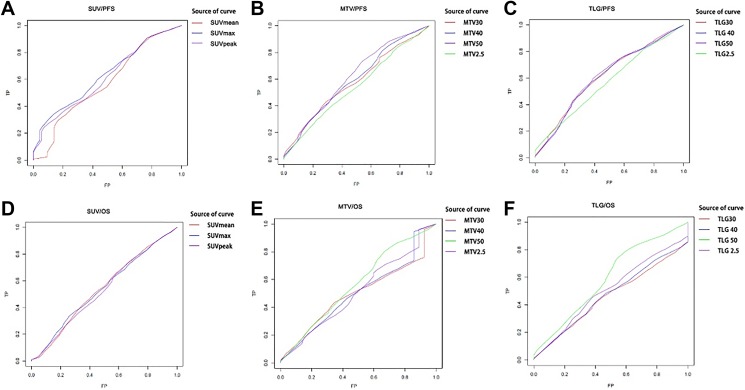
Figure 2.
Survival curves according to different parameters of PET/CT. PFS curve according to (A) SUVs, (B) MTVs, and (C) TLGs, and OS curve according to (D) SUVs, (E) MTVs, and (F) TLGs. CT indicates computed tomography; MTV, metabolic tumor volume; OS, overall survival; PET, positron emission tomography; PFS, progression-free survival; SUVs, standardized uptake values; TLG, total lesion glycolysis.

