
Fig. 6.
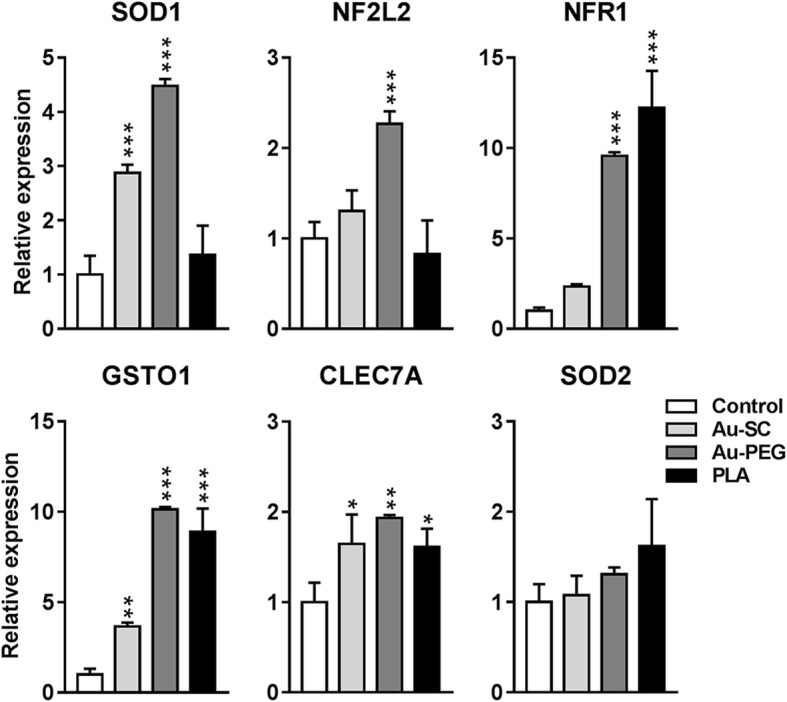
Effect of NP on expression of genes related to ROS regulation in BrainSpheres. Graphs showing the relative expression of SOD1, SOD2, NF2L2, GSTO1, NFR1 and CLEC7A after exposure to Au-SC (6 μg/mL), Au-PEG (20 μg/mL) and PLA-NP (20 μg/mL) for 72 h normalized to the expression of the genes in the untreated control spheroids. Data was collected from three independent experiments and represents fold changes (FC ± SEM, n = 3). One-way ANOVA with Bonferroni’s multiple comparisons post-test was used to analyze the statistical significance (*p < 0.05, **p < 0.01, ***p < 0.001)