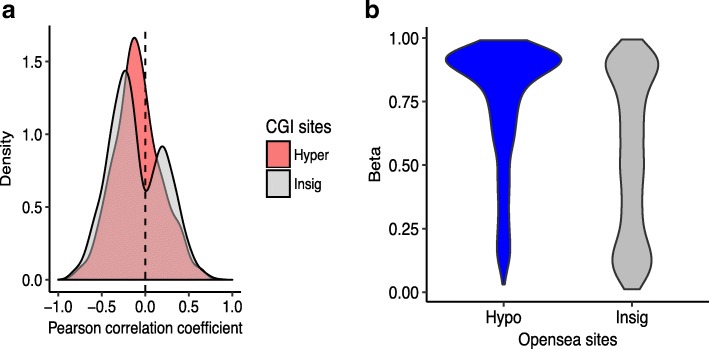
Fig. 3.
Functional implication of hyper- and hypo-methylated sites in LTS-GBM. a Distribution of Pearson correlation coefficients between DNA methylation level (beta) and gene expression measured by RNA-seq (FPKM) across 32 GBM samples in TCGA. The red describes the genes (number of genes: 366) corresponding to the selected hyper-methylated sites in this study while the gray shows the genes (number of genes: 4413) matched to insignificant sites associated with the island. b DNA methylation level around somatic mutations found in 136 TCGA GBM samples by whole exome sequencing. The hypo-methylated sites in LTS-GBM (N = 1802) were compared with the insignificant sites in open sea (N = 5032)

