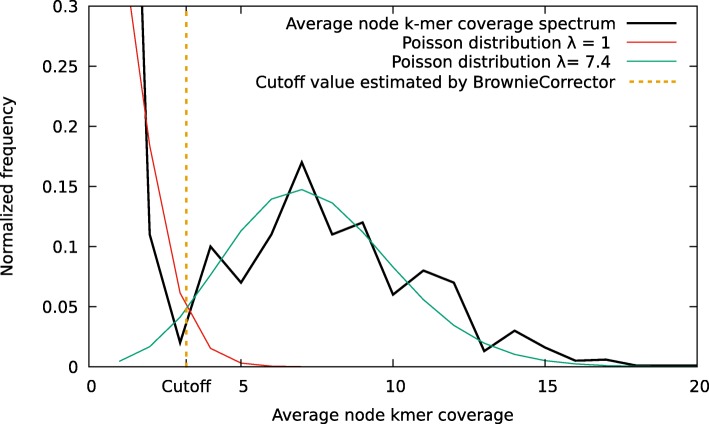
Fig. 4.
Real example of a k-mer frequency spectrum that is a superposition of two distributions corresponding to real and erroneous k-mers, respectively. A model of two Poisson distributions is fit to the data using the expectation-maximization algorithm. The coverage cutoff is established at the intersection of the two distributions

