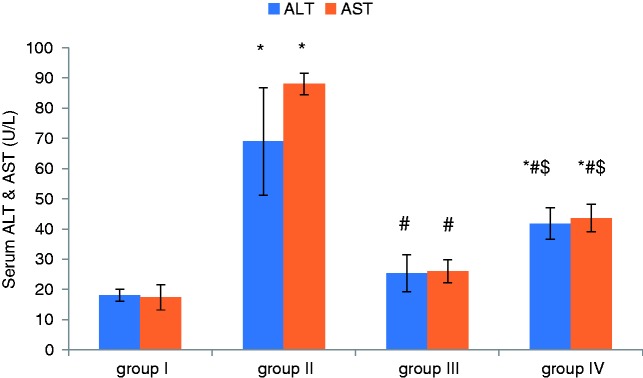
Figure 1.
Comparison of the mean values of ALT and AST among all studied groups.
Values are presented as mean ± SD.
*Statistically significant compared to corresponding value in group I (p < 0.001).
#Statistically significant compared to corresponding value in group II (p < 0.001).
$Statistically significant compared to corresponding value in group III (p < 0.001).
ALT: alanine aminotransferase; AST: aspartate aminotransferase.

