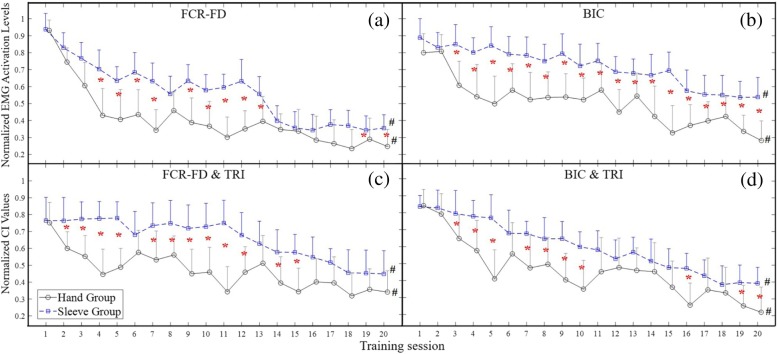
Fig. 4.
The variation of electromyography (EMG) parameters recorded across the 20 training sessions: (a) the changes of the normalized EMG activation levels with significant decline observed in the FCR-FD muscle union (P < 0.05, 1-way ANOVA with Bonferroni post hoc tests) in both the hand group and sleeve group; (b) the significant decline of the normalized EMG activation levels in the BIC muscle (P < 0.05, 1-way ANOVA with Bonferroni post hoc tests) in both groups; (c) the significant decline of the normalized co-contraction indexes (CI) values observed in the FCR-FD&TRI muscle pairs (P < 0.05, 1-way ANOVA with Bonferroni post hoc tests); (d) the changes of CI values with significant decrease in the BIC&TRI muscle pairs (P < 0.05, 1-way ANOVA with Bonferroni post hoc tests). The values are presented as mean value with 2-time SE (error bar) in each session. The solid lines are for the hand group, and the dashed lines are for the sleeve group. The significant inter-group difference is indicated by ‘*’ (P < 0.05, independent t-test) for each session, and ‘#’ is used to indicate the significant intragroup difference across the 20 training sessions

