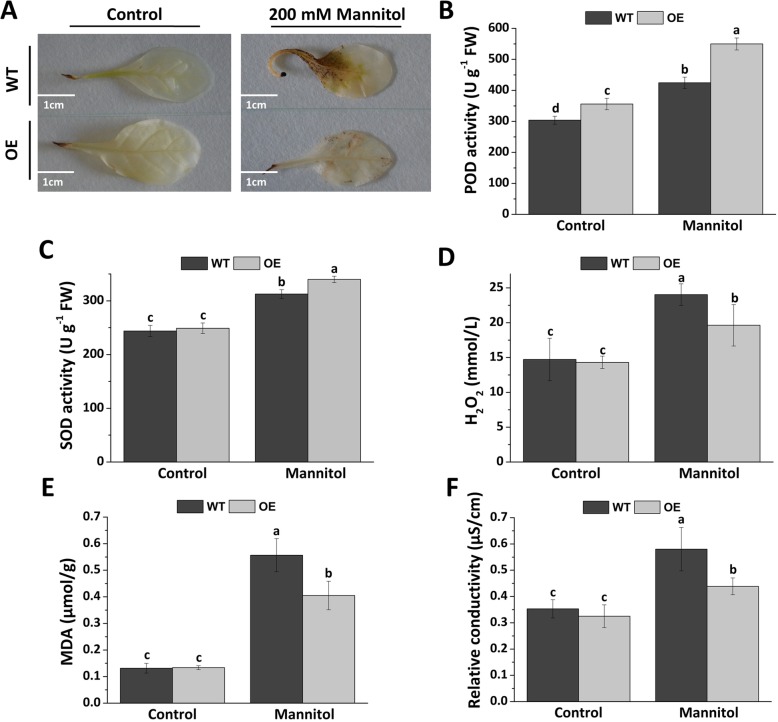
Fig. 7.
Detection of ROS accumulation of WT and OE plants under control and mannitol stress conditions. (a) Detection of ROS using DAB in situ staining (b) POD activity (c) SOD activity (d) Hydrogen peroxide content (e) MDA activity (F) Conductivity activity; Data were represented as the mean ± SE of three biological replicates; statistical significance (P < 0.05) between mannitol treatments is indicated by a, b, and c

