-
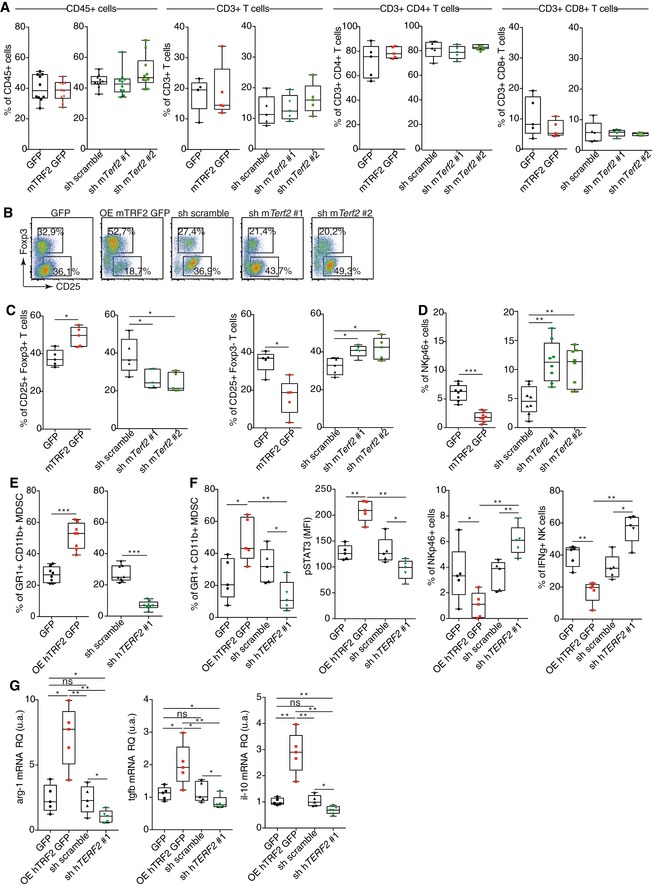
A–D
Analysis of immune cell infiltration in TRF2‐overexpressing or TRF2‐knockdown B16F10 melanoma tumors. Box plots of total immune cell infiltration (CD45+ cells), total T cell infiltration (CD45+ CD3+ T cells), and CD8+ or CD4+ T cells among CD3+ cells infiltrating (A). Representative density plot of regulatory T cells (CD25+ Foxp3+ Treg) and activated T cells (CD25+ Foxp3−) (B). Box plots of infiltrating Treg (CD25+ Foxp3+) and activated T cells (CD25+ Foxp3−) (C) or NK cells (NKp46+ CD3−) (D).
-
E
Analysis of MDSC infiltration in TRF2‐overexpressing or TRF2‐knockdown BJcl2 tumors in Nude mice.
-
F, G
Data used for the correlation analysis presented in Fig
1F–I. Box plots present the percentages of CD11b
Hi GR1
Hi MDSCs among CD45
+ cells infiltrating the Matrigel plug, the mean fluorescence intensity (MFI) of intranuclear pSTAT3 staining in MDSCs, the percentages of intratumoral CD3
− NKp46
+ NK cells among CD45
+ cells, and NKp46
+ IFN‐γ
+ NK cells (F). The mRNA expression level (relative quantity) in the Matrigel plugs of arg1, tgfβ, and il‐10.
Data information: In (A–D), data are presented as box plots min to max showing all points with median from
n = 5 or 10 tumor‐bearing mice per group (*
P < 0.05, **
P < 0.01, and ***
P < 0.001, Mann–Whitney test). In (E), data are presented as box plots min to max showing all points with median from
n = 8 tumor‐bearing mice per group. In (F–G), data are presented as box plots min to max showing all points with median from
n = 8 mice per group of Matrigel plug assay (*
P < 0.05, **
P < 0.01, and ***
P < 0.001, Mann–Whitney test).

