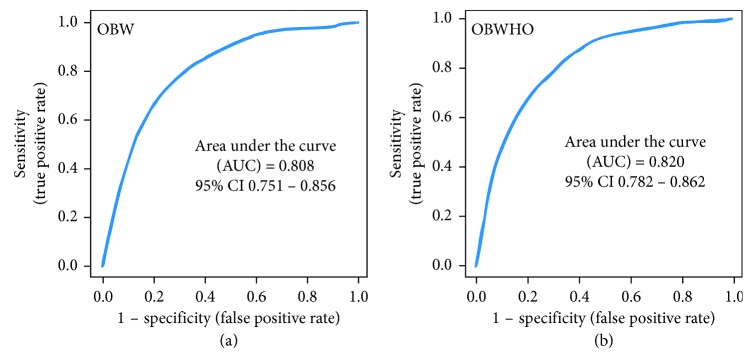
Figure 2.
ROC analysis for classification performance using a subset of top-ranking variables from the aggregated rank list. The smooth ROC was averaged from 100 bootstrap samples, which provided the bootstrap percentile confidence interval. Support vector machine (SVM) was used as the classifier for obesity as defined by (a) waist circumference (OBW) and (b) BMI (OBWHO).

