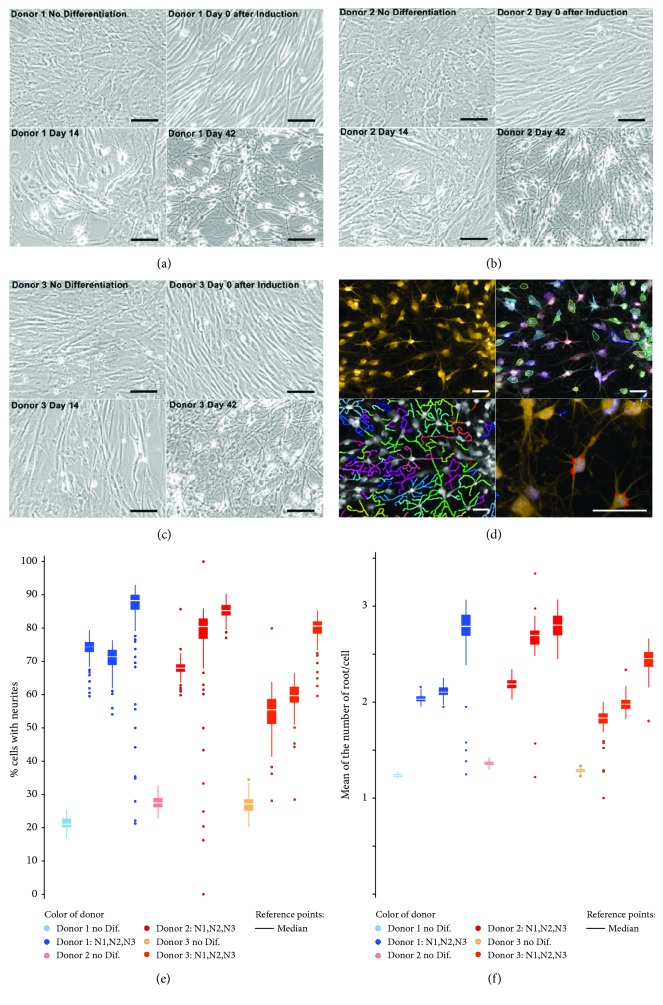
Figure 2.
Morphological changes associated with differentiation sequences. (a–c) Brightfield pictures of olfactory ectomesenchymal stem cells (OE-MSCs), from donor 1 (a), donor 2 (b), and donor 3 (c), at four time points corresponding to key differentiation sequences. Scale bar: 100 μm. (d) Top left, OE-MSCs at Day 42, after CellMask Orange staining. Using Harmony software (PerkinElmer), cell bodies (top right) and neurites (bottom left) were delineated. Bottom right, neuritic roots are highlighted in red. Scale bar: 50 μm. (e) Percentage of neurite-presenting cells from the three donors before differentiation and at Day 42. Triplicate experiments (N1, N2, and N3) displayed similar results. (f) Mean number of neuritic roots per cell.

