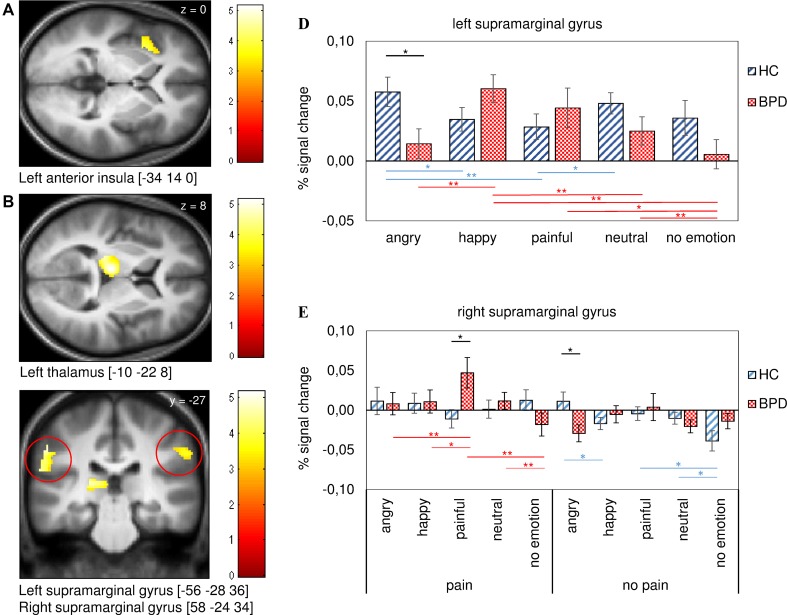
Figure 2.
Activation and signal change in percent for regions of interest (ROIs) derived from the contrast (positive effect of pain) for patients with BPD and healthy controls (HC). Regions shown are the left anterior insula (A), the left thalamus (B), and the left and right supramarginal gyri (C). The statistical parametric maps show a threshold of p [uncorr]. < 0.001 for k > 10. The diagram in Panel (D) shows differences between groups for the facial expressions in the left supramarginal gyrus and the diagram in Panel E contains pain and no pain conditions with preceding facial emotions in the right supramarginal gyrus. Note that differences between groups are marked in black, differences within the BPD group are marked in red, and within the control group in blue. We decided to exclude differences between condition (e.g., [angry face+no pain] vs. [angry face+pain] from diagrams to reduce confusing labeling. Error bars represent standard error of the mean (SEM) and *p < 0.05, **p < 0.010, ***p < 0.001.

