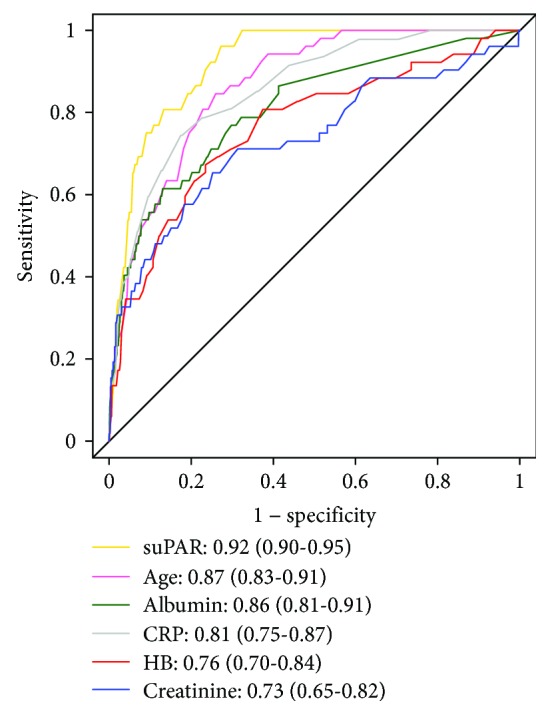
Figure 3.

ROC curve for 30-day mortality. Receiver operating characteristic (ROC) curves displaying the predictive abilities of age, routine biomarkers, and soluble urokinase plasminogen activator receptor (suPAR) regarding 30-day all-cause mortality. Results were reported as the area under the curve with 95% confidence intervals.
