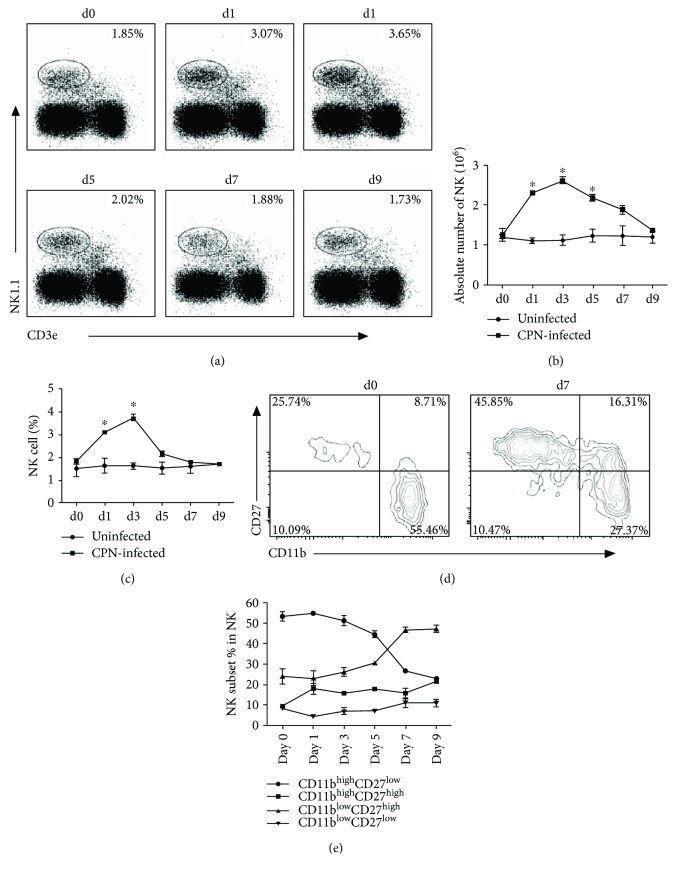
Figure 1.
Cpn lung infection induces expansion of NK cell number and changes the distribution of NK subsets. Mice were infected with 5 × 10⁶ IFUCpn intranasally and killed at specified time points. Splenocytes were stained for NK1.1 and CD3e. (a) Percentage of NK cells (NK1.1+CD3e-) among living lymphocytes was gated according to forward and side scatter. Representative dot plots are shown. (b) Kinetics of the percentage of NK cells. (c) Kinetics of the absolute number of NK cells per mouse spleen. (d) Based on CD11b and CD27 staining, NK cell subsets were analyzed after gating on NK1.1+CD3e- cells. Representative zebra plots for CD11b- and CD27-expressing NK cells before and after Cpn infection were shown. (e) Kinetics of the mean percentage of indicated NK cell subsets are plotted. Data are expressed as mean (n = 4) ± SD and represent three independent experiments. ∗ p < 0.05.

