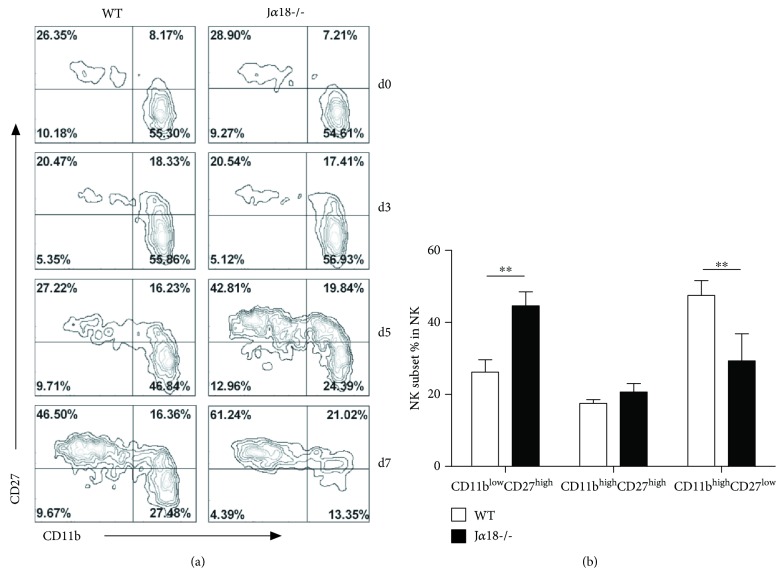
Figure 4.
NK cells from Jα18-/- mice show altered distribution of NK subsets during Cpn infection. Mice were killed at different days following intranasal infection with Cpn EBs (5 × 10⁶ IFUs), and the splenocytes were prepared for flow cytometry. (a) Relative distribution of CD11b- and CD27-expressing NK cells at a steady state and at specified days after infection in WT mice and Jα18-/- mice. Zebra plots were shown from at least three independent experiments. (b) The bar summarizes the relative distribution of splenic NK subsets at day 5 p.i., which are shown as mean ± SD for four mice. ∗∗ p < 0.01.

