Figure 5.
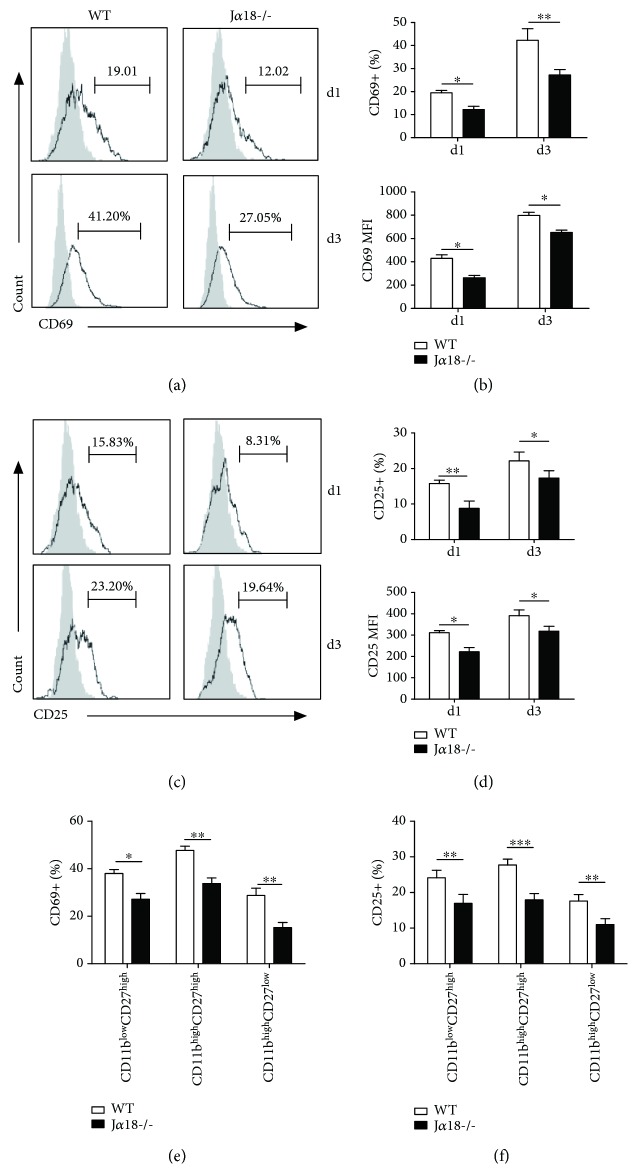
NK cells from Jα18-/- mice show lower CD69 and CD25 expression in response to Cpn infection. WT and Jα18-/- mice were intranasally infected with Cpn (5 × 10⁶ IFUs) and examined at days 1 and 3 p.i. Splenocytes were prepared for flow cytometry analysis. (a) CD69 expression on NK (NK1.1+CD3e-) cells was analyzed at days 1 and 3 p.i. Representative histograms are shown. Filled gray: isotype control Ab staining; black lines: anti-CD69 Ab staining. (b) Summary of the proportion (upper) and the MFI (lower) of CD69 on NK cells. (c) Representative histograms of CD25 expression on NK cells are shown. Filled gray: isotype control Ab staining; black lines: anti-CD25 Ab staining. (d) Summary of the proportion (upper) and the MFI (lower) of CD25 on NK cells. (e) The frequency of CD69 was analyzed on the specified NK cell subsets based on CD11b and CD27 staining at day 3 p.i. (f) The frequency of CD25 was analyzed on the indicated NK cell subsets based on CD11b and CD27 staining at day 3 p.i. The results are shown as mean ± SD of three mice in each group and are representative of three independent experiments. ∗ p < 0.05 and ∗∗ p < 0.01.

