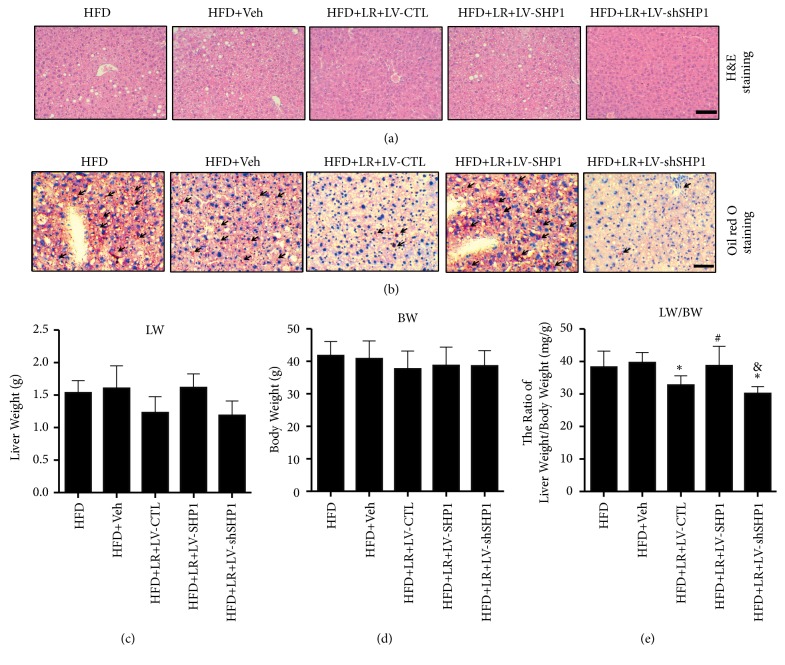
Figure 3.
Overexpression of SHP1 abolished the liver protection of liraglutide in vivo. (a) Liver histology was observed using hematoxylin and eosin staining. The representative images were shown (magnification ×200, scale 20 μm). (b) Hepatic lipid accumulation was observed using Oil Red O staining. The representative images were shown (magnification ×200, scale 20 μm). Black arrows indicated lipid droplets. (c, d, e) The liver weight (LV) and body weight (BW) of each mouse were measured at the end of the experiments. And the ratio of LV versus BW (LV/BW) was calculated. All physiological parameters presented as means±SD from six independent experiments. ⁎ denotes P < 0.05 versus the HFD+Veh group. # denotes P < 0.05 versus the HFD+LR+LV-CTL group. & denotes P < 0.05 versus the HFD+LR+LV-SHP1 group.

