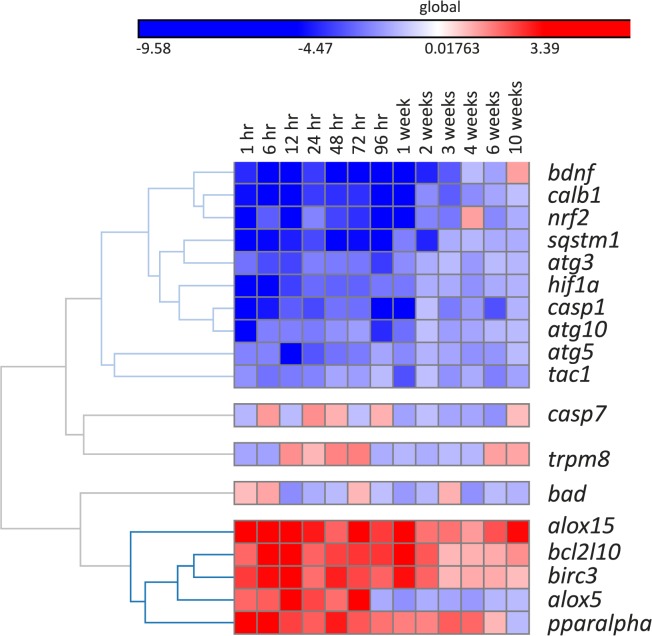
Figure 6.
TG gene expression following corneal injury. Ipsilateral TG were collected at different times after corneal injury. The values correspond to 3 TG/time and were calculated in comparison to 3 TG of different mouse without injury obtained at the same times that the experimental ones. The Fluidigm integrated fluidic circuits 96 genes × 96 samples platform was used to analyze TG gene expression. The heatmap indicated two clusters of gene profile in the TG at the time points of this analysis: (1) downregulated genes (blue colors) from 1 hour until 96 hour or 1 week and (2) upregulated genes (red colors) from the beginning of the injury. All genes with more than two-fold changes, in comparison to the baseline (no injury), were considered significant.

