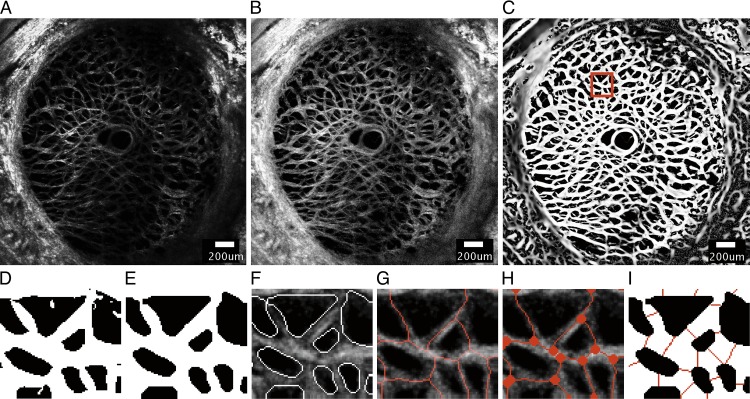
Figure 1.
A series of image-processing steps were applied to the SHG image of a representative specimen (specimen 6) at 5 mm Hg to measure the features of the beam network structure, showing (A) the 30th z-slice of the stitched SHG image acquired by the laser scanning microscope after deconvolution, (B) after contrast-limited adaptive histogram equalization, (C) and after application of the Frangi filter40 to enhance the contrast of the collagen beams. (D) A 198.9 × 219.3-μm area selected from (C) after binarization using the Otsu thresholding method.41 (E) Smoothing, dilation, and erosion were performed to obtain the final binary mask used to segment the beam network for structural characterization. The accuracy of the binary mask was confirmed by (F) overlaying the outline of the segmented structure on the preprocessed images. (G) Skeletonization of collagen beams was obtained by using Matlab function ‘bwmorph' option ‘thin'. (H) Nodes were identified as the junctions where two or more skeletonized beams meet. (I) The width of each collagen beam was measured at the midpoint of the beam by searching for black pixels along the direction perpendicular to the measured beam orientation. Scale bar in (A–C): 200 μm.

