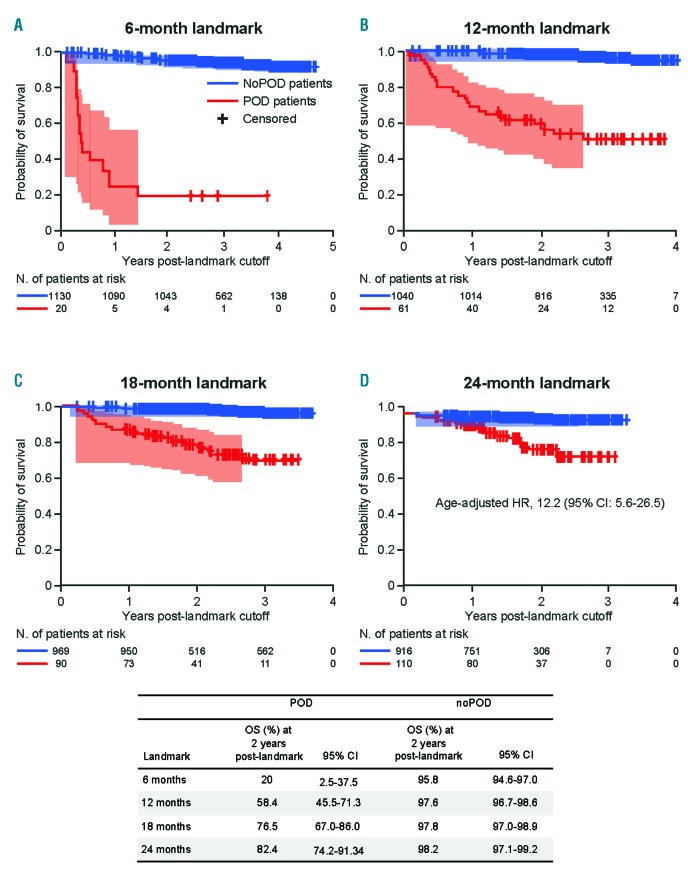
Figure 3.
Landmark overall survival (OS) analysis, comparing patients with progressive disease or death due to progressive disease (POD) before the landmark and patients with noPOD. (A) 6-month, (B) 12-month, (C) 18-month, and (D) 24-month landmarks. The shaded sections of lines show 95% Hall-Wellner confidence bands for the period during which patients died. The table below the graph shows 2-year OS estimates (with 95%CI) at each landmark. N: number; CI: confidence interval; HR: hazard ratio.

