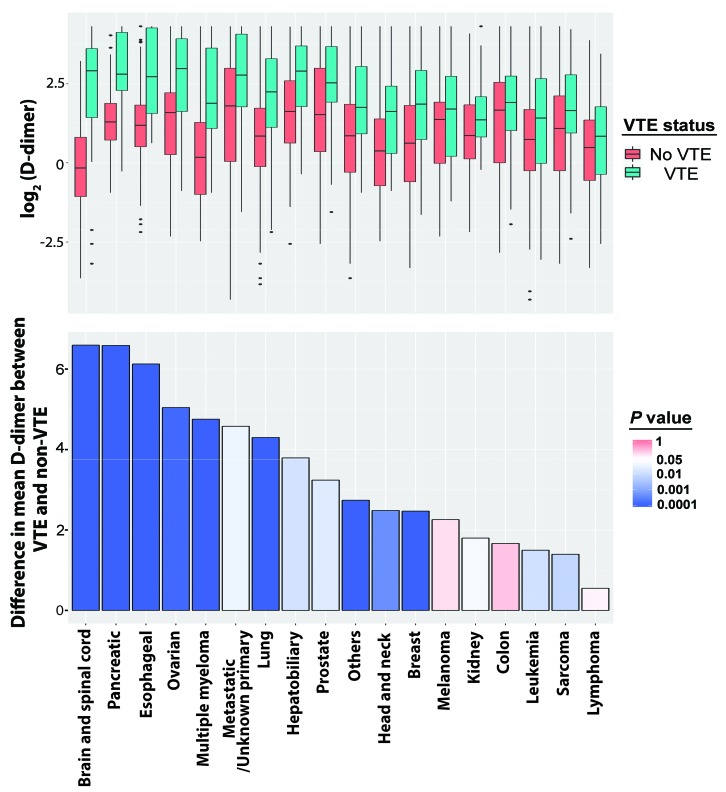
Figure 1.
Comparison of D-dimer levels between patients who had or did not have venous thromboembolism among different types of cancer. Upper panel: boxplots showing the distribution of log2 D-dimer levels for each cancer type in the presence or absence of venous thromboembolism (VTE). Lower panel: bar graph showing the differences in mean D-dimer levels between patients who had VTE and patients who did not have VTE for each cancer type. The median differences were compared using the Mann–Whitney U test and P values are plotted as a color scale representing the significance of differences between the two groups.

