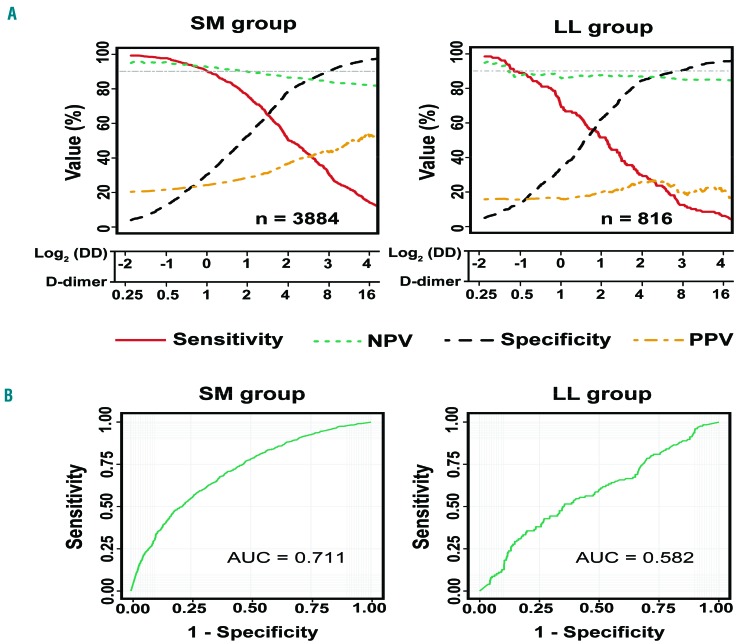
Figure 2.
Performance of D-dimer levels in the prediction of venous thromboembolism in the group with solid cancers and multiple myeloma and in the group with lymphoma and leukemia. (A) Sensitivity, specificity, negative predictive value (NPV), and positive predictive value (PPV) of D-dimer for the group with solid cancers and multiple myeloma (SM) and the group with lymphoma and leukemia (LL). (B) Receiver operating characteristic curve analysis of D-dimer for the prediction of venous thromboembolism in the SM and LL groups. AUC: area under the curve.

